– by New Deal democrat One item I meant to address with this week’s existing and new home sales data was the relative difference in price in the two, and the effect on the relative share of the market. I am following up now because yesterday Kevin Drum put up a post yesterday in which he concluded that “The price of a new house is now below its pre-pandemic trendline and heading toward its 2020 level . . . When the Fed finally gets around to lowering interest rates, the real cost of buying a home will be back to normal.“ Not exactly. The graph Kevin puts up only goes back to 2013. Let’s take a longer-term look. The first graph below divides the median price of a new home by the average weekly earnings on nonsupervisory workers (blue),
Topics:
NewDealdemocrat considers the following as important: Existing v New Housing, Hot Topics, US EConomics
This could be interesting, too:
NewDealdemocrat writes JOLTS revisions from Yesterday’s Report
Joel Eissenberg writes No Invading Allies Act
Bill Haskell writes The North American Automobile Industry Waits for Trump and the Gov. to Act
Bill Haskell writes Families Struggle Paying for Child Care While Working
– by New Deal democrat
One item I meant to address with this week’s existing and new home sales data was the relative difference in price in the two, and the effect on the relative share of the market.
I am following up now because yesterday Kevin Drum put up a post yesterday in which he concluded that “The price of a new house is now below its pre-pandemic trendline and heading toward its 2020 level . . . When the Fed finally gets around to lowering interest rates, the real cost of buying a home will be back to normal.“
Not exactly. The graph Kevin puts up only goes back to 2013. Let’s take a longer-term look.
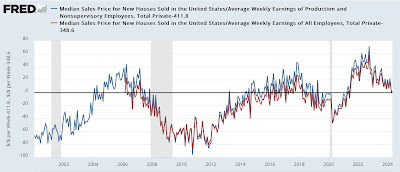
The first graph below divides the median price of a new home by the average weekly earnings on nonsupervisory workers (blue), and all workers including supervisors (red), both adjusted to zero at their current readings:
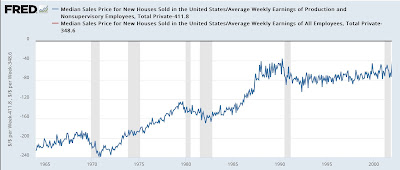
The current levels for both are in the upper reaches of their readings since the turn of the Millennium, and only about 10% lower than at the peak of the housing bubble. The latter metric only goes back to 2008, but here is the former one extended all the way back to its inception in the 1960s:
You can see that it took about 200 weeks’ pay to buy the median new single family home in the 1960s, rising to about 350 by 2000. So the current level of 411 remains historically very high.
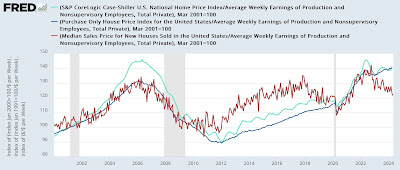
Now here is the same metric applied to repeat existing home sales as measured by both Case-Shiller (light blue) and the FHFA (dark blue) compared with the median price of a new home for nonsupervisory workers (red) as in the graph above (all metrics normed to 100 as of 2001):
Both new and existing homes went up about 20% immediately after the pandemic. Since then new homes have given back about half of that increase, while existing homes have given back none of it.
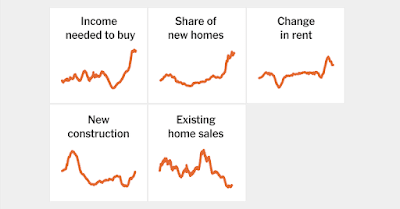
Finally, here is a series of graphs I cribbed from Ben Casselman of The Economist. Note in particular the “Share of New Homes” graph:
It is showing a sharp increase in the percentage of the housing market taken by new homes vs. existing homes (since Realtors do not allow FRED to post multi-year data on existing home sales, it’s not available there).
Snail’s pace of housing market rebalancing, as existing sales remain range bound, and inventory has not increased enough to relieve pricing pressure, Angry Bear, by New Deal democrat


