– by New Deal democrat The Bonddad Blog Most of the commentary you will read about Q1 GDP that was released this morning will be about the core coincident components. For that I will simply outsource to Harvard’s Prof. Jason Furman: “much of the slowdown was in non-inertial items like inventories (-0.35pp) and net exports (-0.86pp). The better signal of final sales to private domestic purchasers was 3.1%.” I agree. With that out of the way, as usual, my focus is instead on what the leading indicators contained in the report can tell us about the months ahead. There are two such long leading indicators: private residential fixed investment (basically, housing) as a share of GDP, and deflated corporate profits. Let’s look at each one
Topics:
NewDealdemocrat considers the following as important: 1st Qtr 2024, Hot Topics, leading indicators, US EConomics
This could be interesting, too:
NewDealdemocrat writes JOLTS revisions from Yesterday’s Report
Joel Eissenberg writes No Invading Allies Act
Bill Haskell writes The North American Automobile Industry Waits for Trump and the Gov. to Act
Bill Haskell writes Families Struggle Paying for Child Care While Working
– by New Deal democrat
The Bonddad Blog
Most of the commentary you will read about Q1 GDP that was released this morning will be about the core coincident components. For that I will simply outsource to Harvard’s Prof. Jason Furman:
“much of the slowdown was in non-inertial items like inventories (-0.35pp) and net exports (-0.86pp). The better signal of final sales to private domestic purchasers was 3.1%.”
I agree.
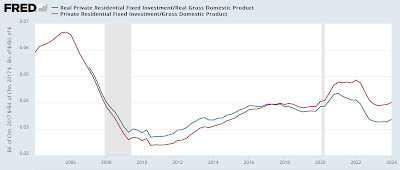
With that out of the way, as usual, my focus is instead on what the leading indicators contained in the report can tell us about the months ahead. There are two such long leading indicators: private residential fixed investment (basically, housing) as a share of GDP, and deflated corporate profits.
Let’s look at each one in turn.
Nominal private residential fixed investment increased 3.5% during the first quarter. Real private residential fixed investment increased 3.3%. Since both of those were bigger increases than the % change in nominal and real GDP for the quarter, respectively, both improved as a share of GDP, as shown below:
Not strong improvement, but improvement nevertheless.
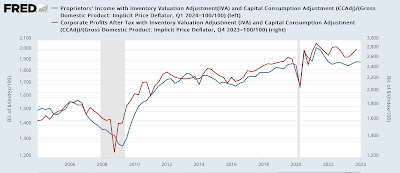
Since corporate profits for the Quarter aren’t reported in the first release, we turn to the proxy of proprietors’ income. The proper measure deflates by unit labor costs. Those won’t be reported until later either, so the GDP price deflator is a good proxy. Going back 50+ years, our substitute typically turns coincident with or one quarter later than the official leading indicator.
Nominally proprietors’ income rose 0.5% in the quarter. But since the GDP deflator increased 0.8%, their deflated income declined slightly (blue in the graph below):
Real proprietors’ income has been essentially flat for the past two years.
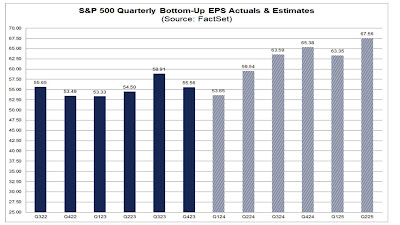
It’s worth noting that (nominal) corporate profits as reported to Wall Street, updated through last week, with the exception of Q3 of last year haven’t gone anywhere in two years either:
When profit growth stalls, companies start looking around for costs to cut, and usually that includes employees. So that’s not good.
So our leading indicators from the Q1 GDP report score as one positive and one neutral. Several other of the long leading indicators have gotten “less bad” in the past half year. Once Q1 bank lending conditions are reported in a week or two, I will update my top-of-the-line long leading forecast through the end of the year.
Leading Indicators Continue to Improve, Angry Bear by New Deal democrat


