Scenes from the February jobs report: yes, the Household Survey really was recessionary – by New Deal democrat Later this week we get a lot of interesting reports, including CPI tomorrow, retail sales on Thursday, and industrial production on Friday. In the meantime, let’s take a further look at some of the more noteworthy data from Friday’s employment report. In particular, as I wrote then, the Household Survey portion of that report was downright recessionary. Let me show you why. Let’s start with YoY civilian employment. This is only up 0.4%. (Note: in this graph, as in all of the below graphs except for the last one, I subtract the current value so that it shows exactly at the zero line for easy comparison with previous occasions where
Topics:
NewDealdemocrat considers the following as important: 2024, February jobs report, Hot Topics, US EConomics
This could be interesting, too:
NewDealdemocrat writes JOLTS revisions from Yesterday’s Report
Joel Eissenberg writes No Invading Allies Act
Bill Haskell writes The North American Automobile Industry Waits for Trump and the Gov. to Act
Bill Haskell writes Families Struggle Paying for Child Care While Working
Scenes from the February jobs report: yes, the Household Survey really was recessionary
– by New Deal democrat
Later this week we get a lot of interesting reports, including CPI tomorrow, retail sales on Thursday, and industrial production on Friday. In the meantime, let’s take a further look at some of the more noteworthy data from Friday’s employment report. In particular, as I wrote then, the Household Survey portion of that report was downright recessionary. Let me show you why.
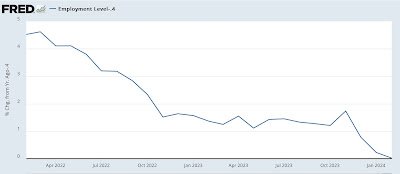
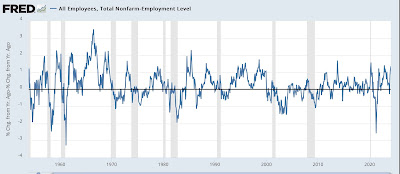
Let’s start with YoY civilian employment. This is only up 0.4%. (Note: in this graph, as in all of the below graphs except for the last one, I subtract the current value so that it shows exactly at the zero line for easy comparison with previous occasions where the YoY value has been the same):
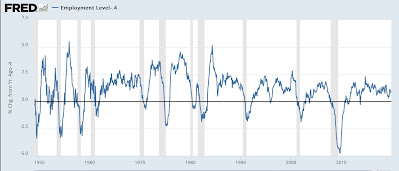
In the past 75 years, that has only occurred 5 times not associated with recessions: 1952, 1995, 2003, 2011, and 2013:
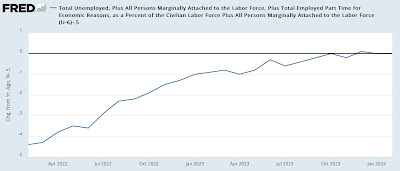
U6 underemployment is up 0.5% YoY:
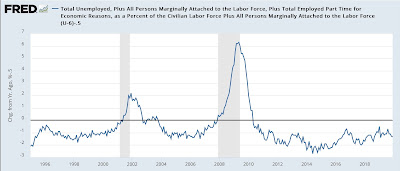
In that series 30 years of existence, that has only happened once outside of a recession, in 2003:
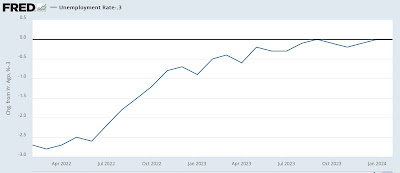
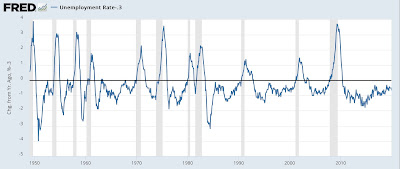
U3 unemployment is up 0.3% YoY:
That has occurred outside of recessions 5 times in the past 75 years: in 1952, 1956, 1963, 1967, and 2003
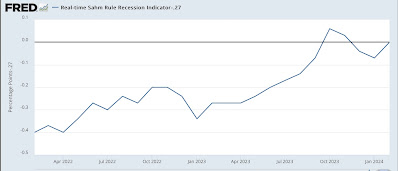
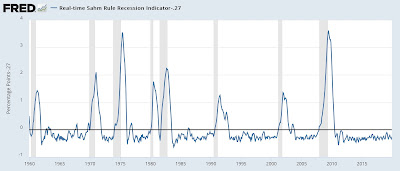
Finally, while the Sahm rule, which requires the 3 month average of the unemployment rate to be higher by 0.5% from its low in the previous 12 months, has not been triggered, that metric is up .27%:
That has occurred outside of a recession occurring only 5 times as well: 1962-63, 1967, 1977, 1986, and 2003:
In other words, more often than not when any of these Household Survey metrics have been at these levels in the past, it has been shortly before or early in a recession.
The current divergence between YoY job growth as measured by the Establishment and Household Surveys is 1.36% (By the Establsihment Survey, jobs have increased 1.6% YoY vs. the 0.2% in the Household Survey). Since the Korean War, that big a divergence has occurred 17 times in over 800 months, usually only lasting one month:
Based on past experience, I expect the two surveys to track more closely in the months ahead. The question is, which one will resolve towards the other? At any given time, there is always some metric that is going to be recessionary, and another which supports expansion. In this case, I suspect the Household Survey’s weakness will be the metric that proves transitory, but for now that weakness is very much real.
February jobs report: Household Survey is downright recessionary and the Establishment Survey is decidedly mixed, Angry Bear, by New Deal democrat

