– by New Deal democrat There’s no big economic news today, but yesterday existing home sales were released. While they have historically constituted up to 90% of the entire market, they have much less economic impact than new home sales, which involve all sorts of construction activity, followed by landscaping, furnishings, and other sales. Since the Fed started raising rates two years ago, the two markets have gone in entirely different directions. Existing homeowners are largely trapped by new or refinanced mortgages in the 3% range, while builders of new homes can make all sorts of accommodations to entice buyers even with mortgage rates near 7%. As a result, the existing home market for all intents and purposes froze. Yesterday’s report
Topics:
NewDealdemocrat considers the following as important: 2024, existing homes, Hot Topics, US EConomics
This could be interesting, too:
NewDealdemocrat writes JOLTS revisions from Yesterday’s Report
Joel Eissenberg writes No Invading Allies Act
Bill Haskell writes The North American Automobile Industry Waits for Trump and the Gov. to Act
Bill Haskell writes Families Struggle Paying for Child Care While Working
– by New Deal democrat
There’s no big economic news today, but yesterday existing home sales were released. While they have historically constituted up to 90% of the entire market, they have much less economic impact than new home sales, which involve all sorts of construction activity, followed by landscaping, furnishings, and other sales.
Since the Fed started raising rates two years ago, the two markets have gone in entirely different directions. Existing homeowners are largely trapped by new or refinanced mortgages in the 3% range, while builders of new homes can make all sorts of accommodations to entice buyers even with mortgage rates near 7%.
As a result, the existing home market for all intents and purposes froze. Yesterday’s report on existing home sales showed that there is a little thawing going on – but hold the pom poms for now.
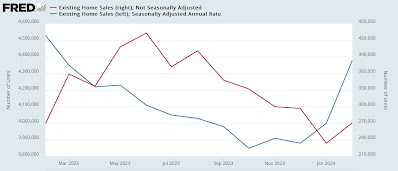
The seasonally adjusted annual pace of existing home sales rose 38,000 to 438,000 in February, vs, 4,530,000 one year ago. But as the comparison with non-seasonally adjusted data shows, February is typically one of the slowest sales months of the year. Thus a relatively small change – caused by, say, unusually accommodating winter weather – can make a big difference in the seasonally adjusted rate:
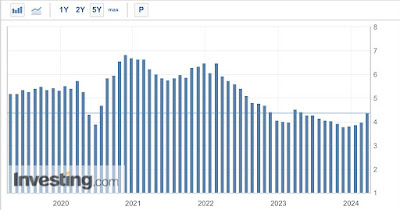
When we step back and look at the data for the past 5 years, we can see that there was a similar jump in February of last year as well, that made for the highest seasonally adjusted total for the entire year:
As usual, take one month’s seasonally adjusted data, especially during winter months, with an extra grain of salt.
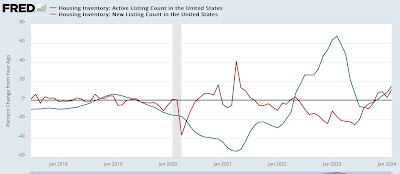
There are signs of some improvement in the market. Both total active listings (blue) and new listings (red) housing inventory has been higher YoY for the past four months:
For new listings, this is the first sustained uptick in three years.
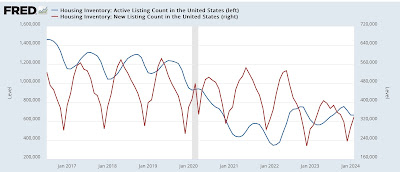
But if this is a thaw, it is only the beginning of the thaw, as we can see when we look at the absolute levels rather than the YoY changes (note separate scales):
The first thing to point out is that this data is not seasonally adjusted. Typically listings bottom in December or January, and improve until mid year. So we need to compare this February with February in previous years.
Before the pandemic, total active listings in February averaged just over 1 million units. New listings averaged about 425,000 for the month. After the pandemic struck, both really plunged, with active listings in February bottoming at 347,000 in 2022, while new listings in February bottomed at 305,000 last year. In February this year, active listings totaled 665,000 and new listings totaled 339,000.
In other words, while there are definitely signs of improvement, the existing home market has a long ways – as in, about 400,000 more monthly active listings and 100,000 new monthly listings – to go.
Signs of a thaw in the frozen existing homes market, but a very long way to go, The Bonddad Blog, New Deal democrat
House resale price indexes confirm upturn in prices for existing homes, but do not negate combined price declines, Angry Bear by New Deal democrat


