One of the Fed’s mandates. The ‘headline’ number is below target due to the energy impulse, but the ‘core’ rate, led by services, is on target. The question is whether energy prices, if they remain at current levels, will ‘pull down’ other prices. And the comparisons with last year are now vs the lower numbers that were released after the oil price collapse. And not to forget that the Fed uses futures prices as indications of future spot prices, even for non perishables, which technically only represent ‘storage prices’. So with oil futures prices substantially higher than spot (due to elevated storage costs which have been supported by Iran storing oil in anticipation of being able to sell it next year) the Fed’s forecasts will use those elevated prices to forecast that much more inflation. United States : Consumer Price IndexHighlightsConsumer price inflation is very low though the deflationary thrust may be clearing. The CPI came in as expected with no change in November with the core rate, which excludes food and energy, also coming in at expectations with a moderate 0.2 percent gain.Many components show declines in the month including transportation, apparel (where low import prices are still at play), and recreation. Food prices also fell in the month, which is the first drop since March, while energy prices really fell, down 1.3 percent in November reflecting a 2.
Topics:
WARREN MOSLER considers the following as important: Employment, housing, inflation
This could be interesting, too:
Nick Falvo writes Subsidized housing for francophone seniors in minority situations
Matias Vernengo writes Serrano, Summa and Marins on Inflation, and Monetary Policy
Angry Bear writes Voters Blame Biden and Harris for Inflation
NewDealdemocrat writes Declining Housing Construction
One of the Fed’s mandates. The ‘headline’ number is below target due to the energy impulse, but the ‘core’ rate, led by services, is on target. The question is whether energy prices, if they remain at current levels, will ‘pull down’ other prices. And the comparisons with last year are now vs the lower numbers that were released after the oil price collapse.
And not to forget that the Fed uses futures prices as indications of future spot prices, even for non perishables, which technically only represent ‘storage prices’.
So with oil futures prices substantially higher than spot (due to elevated storage costs which have been supported by Iran storing oil in anticipation of being able to sell it next year) the Fed’s forecasts will use those elevated prices to forecast that much more inflation.
United States : Consumer Price Index
Highlights
Consumer price inflation is very low though the deflationary thrust may be clearing. The CPI came in as expected with no change in November with the core rate, which excludes food and energy, also coming in at expectations with a moderate 0.2 percent gain.Many components show declines in the month including transportation, apparel (where low import prices are still at play), and recreation. Food prices also fell in the month, which is the first drop since March, while energy prices really fell, down 1.3 percent in November reflecting a 2.4 percent decline for gasoline in a dip that continues to extend through December as well. But there are areas showing pressure including medical care for a second month in a row. Housing is also up but only at a moderate 0.2 percent with owner’s equivalent rent also up 0.2 percent.
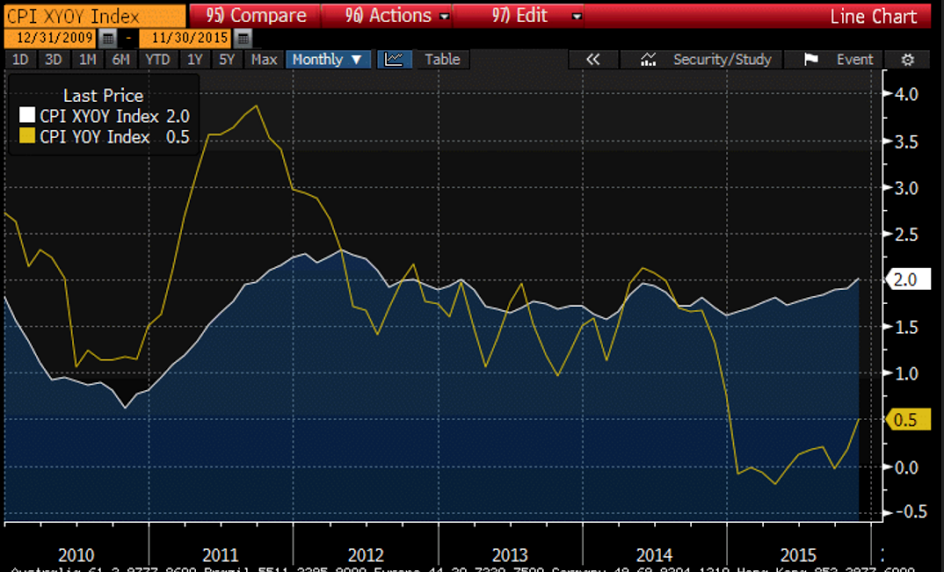
Year-on-year prices are showing lift but reflect easy comparisons with price weakness this time last year. The overall rate is up 0.5 percent, 3 tenths higher in the month, with the core rate up 1 tenth to 2.0 percent which hits the Fed’s target.
This report is in line with the Fed’s outlook, showing an easing, at least to a degree, in deflationary pressures. But still falling fuel prices are definitely a live risk to the Fed’s inflation hopes.
Core vs. headline CPI:
The Fed uses the prices in green when forecasting inflation:
More bad stuff here. Employment is the Fed’s other mandate:
Empire State Mfg Survey
Highlights
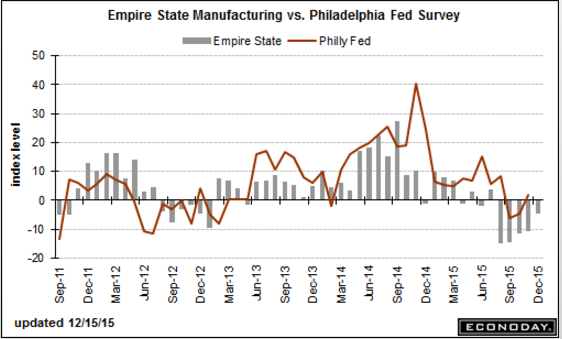
Factory activity continues to contract in the New York manufacturing region and especially, unfortunately, employment and the workweek. The Empire State index posted its fifth negative reading in a row, minus 4.59 for December which however is the least weak reading of the run. New orders, at minus 5.07, are down for a seventh month in a row but here to the degree of contraction is easing. Not easing, however, is employment which is deeply negative at minus 16.16 for the fourth contraction in a row and the deepest since July 2009. The workweek is another disappointment, at minus 27.27 for the worst reading since even further back, to April 2009.But there are pluses in this report led by a big gain for the six-month outlook, to 38.51 from 20.33. The gain reflects greater optimism for new orders and shipments but no greater optimism for employment where hiring is expected to be no more than moderate.
Turning back to negatives, prices received are down for a fourth month in a row, at minus 4.04. Contraction in prices for finished goods points to price concessions and lack of demand.
The recovery worst readings for employment and the workweek are definitely worrisome signs. Yes, this report has been running lower than other regional manufacturing reports but today’s results do not point to any year-end lift for the factory sector which is being hit by low exports and low prices.

Down again, not good:
And housing indicators continue to slow, contrary to all forecasts:

