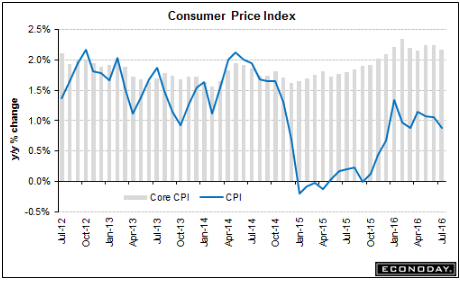
Lots of nuances but still tending to keep the Fed on hold: HighlightsThe headlines for the consumer price report look very soft but there are important offsetting pressures. The CPI came in unchanged in July, pulled back by a 1.6 percent monthly decline in energy prices and other weakness including flat prices for food and contraction in transportation. And it doesn’t look much better when excluding food & energy where the gain for the core is only 0.1 percent. But two important categories — medical and housing — both show life. Medical care prices jumped 0.5 percent in the month for a year-on-year rate that leads the major readings, at a downright inflationary 4.0 percent. Housing costs rose 0.3 percent in the month with this year-on-year at 2.4 percent which, next to medical care, is the second highest on the list. Total year-on-year prices are up only 0.8 percent with the closely watched core dipping 1 tenth to 2.2 percent. But the decline in energy and transportation can very well reverse quickly as could the lack of pressure in food prices. But medical and housing costs are a core of their own and should give policy makers confidence that their efforts to lift inflation are making incremental progress. Starts better than expected but permits down and looking very weak.
Topics:
WARREN MOSLER considers the following as important: Uncategorized
This could be interesting, too:
tom writes The Ukraine war and Europe’s deepening march of folly
Stavros Mavroudeas writes CfP of Marxist Macroeconomic Modelling workgroup – 18th WAPE Forum, Istanbul August 6-8, 2025
Lars Pålsson Syll writes The pretence-of-knowledge syndrome
Dean Baker writes Crypto and Donald Trump’s strategic baseball card reserve
Lots of nuances but still tending to keep the Fed on hold: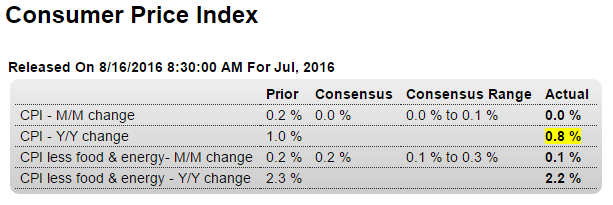
Highlights
The headlines for the consumer price report look very soft but there are important offsetting pressures. The CPI came in unchanged in July, pulled back by a 1.6 percent monthly decline in energy prices and other weakness including flat prices for food and contraction in transportation. And it doesn’t look much better when excluding food & energy where the gain for the core is only 0.1 percent.But two important categories — medical and housing — both show life. Medical care prices jumped 0.5 percent in the month for a year-on-year rate that leads the major readings, at a downright inflationary 4.0 percent. Housing costs rose 0.3 percent in the month with this year-on-year at 2.4 percent which, next to medical care, is the second highest on the list.
Total year-on-year prices are up only 0.8 percent with the closely watched core dipping 1 tenth to 2.2 percent. But the decline in energy and transportation can very well reverse quickly as could the lack of pressure in food prices. But medical and housing costs are a core of their own and should give policy makers confidence that their efforts to lift inflation are making incremental progress.
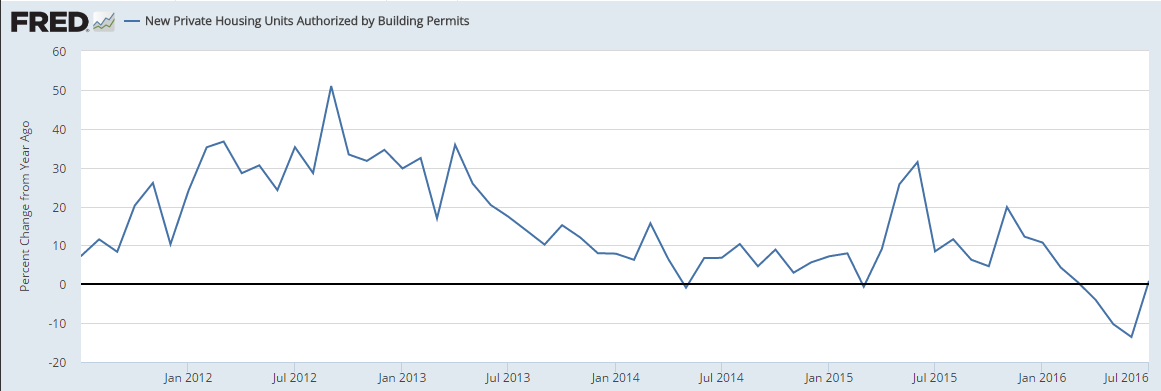
Starts better than expected but permits down and looking very weak. And as you don’t build a house without a permit, not looking good for starts for the rest of q3:

Highlights
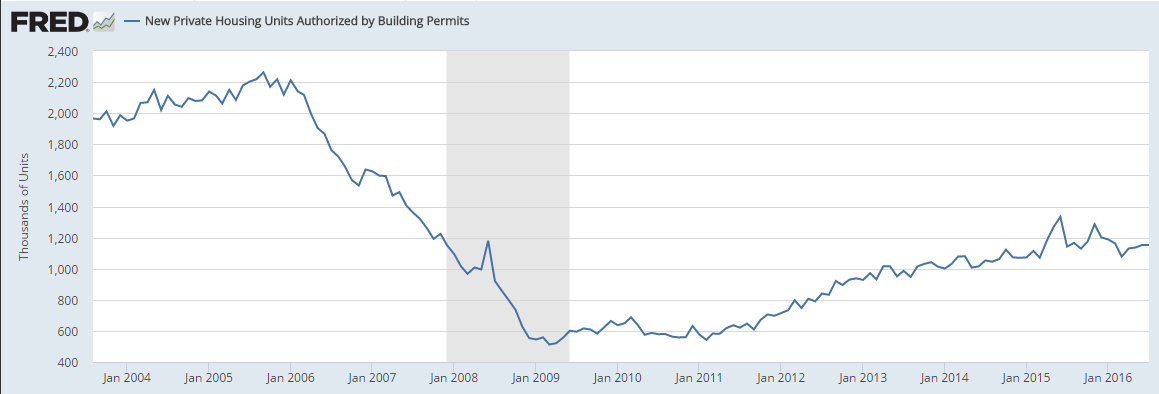
Housing starts are strong but permits are flat in what are mixed indications for the nation’s housing sector. July starts rose a strong 2.1 percent to a 1.211 million annualized rate which comes on top of June’s 5.6 percent surge. Starts for single-family homes, the most important category, rose a very respectable 0.5 percent in July but were dwarfed by a 5.0 percent surge for multi-family homes. These results point to ongoing strength for construction.But there may be less strength ahead based on permits which show little change, at a 1.152 million rate in July. Here the single-family reading is down 3.7 percent, offset by a jump in multi-family permits of 6.3 percent. But single-family homes are costlier to build and the decline in permits here is a major offset to the gain for multi-family units.
The housing sector is a positive for this year’s economy though it’s performance continues to be less than smooth.
Building Permits:
Privately-owned housing units authorized by building permits in July were at a seasonally adjusted annual rate of 1,152,000. This is 0.1 percent below the revised June rate of 1,153,000, but is 0.9 percent above the July 2015 estimate of 1,142,000.Read more at http://www.calculatedriskblog.com/#WoS6ZvcHVCFmJYeR.99
Looking like housing will add little if any to growth this year:
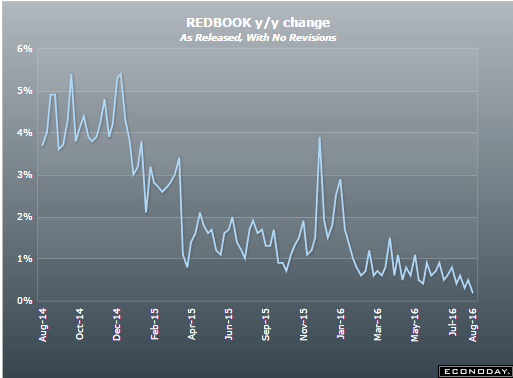
Just another indication of weak retail sales:
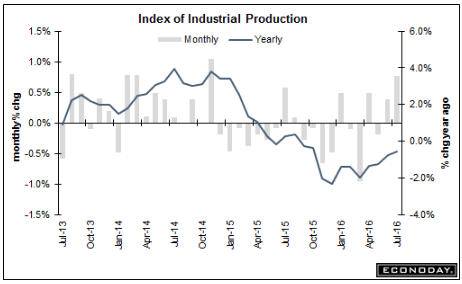
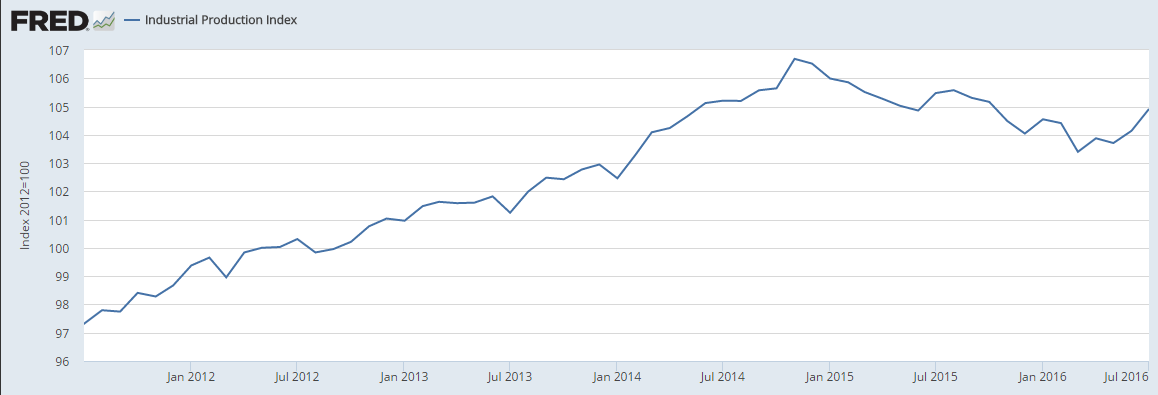
Up more than expected (due to in part to added air conditioning usage) but last month’s ‘good’ number revised down, so best to reserve judgement on this month’s number. And in any case, the year over year performance remains at recession type levels:

Highlights
Strength in manufacturing leads a strong industrial production report where the July headline jumped 0.7 percent to give a big 1/2 point lift to the capacity utilization rate which is at 75.9 percent.Manufacturing output rose 0.5 percent in the month which follows a downward revised but still very respectable 0.3 percent gain in June. Vehicle production was exceptionally strong in June and was also very solid in July though other manufacturing industries were also strong contributors to the latest month’s gain. Hi-tech was strong in the month and a look at market groups shows 0.6 percent monthly gains for both consumer goods and business goods, the latter a plus given the persistent weakness in business investment.
Outside of manufacturing, utility production jumped 2.1 percent for a second straight month reflecting what has been a strong cooling season. Mining also was a positive contributor, up 0.7 percent in the month though year-on-year output here is still down in the double digits, at minus 10.2 percent.
Though these results are very positive and point to a strong factory contribution to the ongoing economy, weakness in separate data on factory orders unfortunately is not pointing to further gains ahead for manufacturing production.
Note that the traditional non-NAICS numbers for industrial production may differ marginally from the NAICS basis figures.
From the Fed: Industrial production and Capacity Utilization
Industrial production rose 0.7 percent in July after moving up 0.4 percent in June. The advance in July was the largest for the index since November 2014. Manufacturing output increased 0.5 percent in July for its largest gain since July 2015. The index for utilities rose 2.1 percent as a result of warmer-than-usual weather in July boosting demand for air conditioning. The output of mining moved up 0.7 percent; the index has increased modestly, on net, over the past three months after having fallen about 17 percent between December 2014 and April 2016. At 104.9 percent of its 2012 average, total industrial production in July was 0.5 percent lower than its year-earlier level. Capacity utilization for the industrial sector increased 0.5 percentage point in July to 75.9 percent, a rate that is 4.1 percentage points below its long-run (1972–2015) average.
Read more at http://www.calculatedriskblog.com/#WoS6ZvcHVCFmJYeR.99
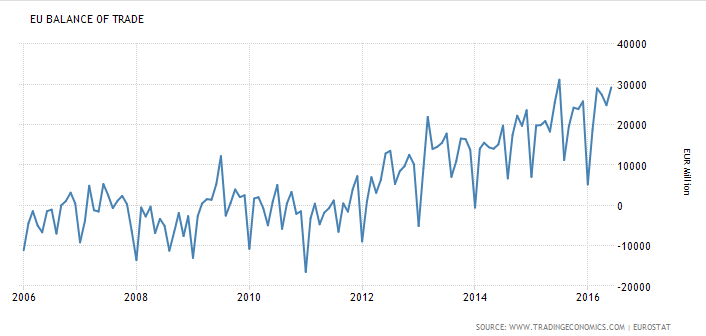
The trade surplus offers fundamental support for the euro, even as total trade is weakening which tends to indicate weakening global demand:
Euro Area Balance of Trade
The trade surplus in the Euro Area increased 14.9 percent year-on-year to € 29.2 billion in June of 2016 as exports decreased 2.2 percent while imports shrank at a faster 5 percent. Figures compare with market forecasts of a € 25.8 billion surplus. It was the biggest trade surplus since July last year.
