The chart still looks weak to me. Shale boom in 2014 pumped it up, and then reversing with the shale bust, and still looking suspect after January when consumer credit further decelerated: Highlights The consumer was back in the stores last month in a July retail sales report, headlined by a 0.6 percent monthly gain, that not only exceeds top expectations but also includes sizable upward revisions. Nonstore retailers, vehicle dealers, building materials stores lead the report — all major categories. Secondary readings are all strong: up 0.5 percent ex-autos, up 0.5 percent ex-autos ex-gas, and up 0.6 percent for the control group. Revisions are prominent in this report with June revised 5 tenths overall to plus 0.3 percent from an initial minus 0.2 percent. And May gets
Topics:
WARREN MOSLER considers the following as important: Uncategorized
This could be interesting, too:
tom writes The Ukraine war and Europe’s deepening march of folly
Stavros Mavroudeas writes CfP of Marxist Macroeconomic Modelling workgroup – 18th WAPE Forum, Istanbul August 6-8, 2025
Lars Pålsson Syll writes The pretence-of-knowledge syndrome
Dean Baker writes Crypto and Donald Trump’s strategic baseball card reserve
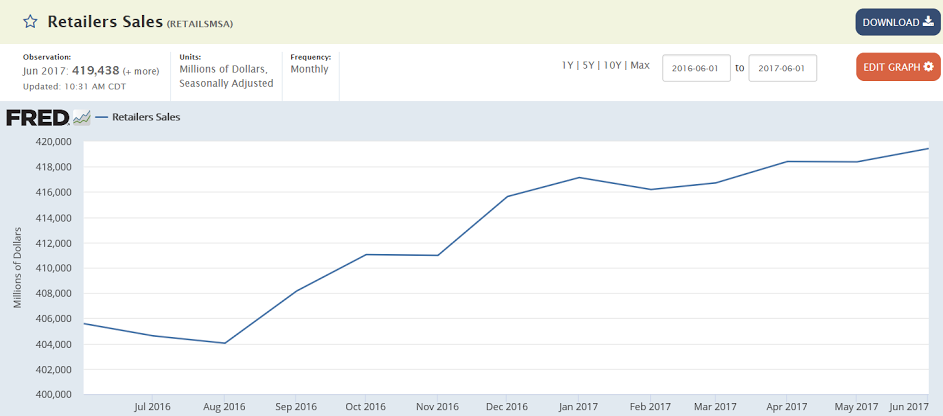
The chart still looks weak to me. Shale boom in 2014 pumped it up, and then reversing with the shale bust, and still looking suspect after January when consumer credit further decelerated:

Highlights
The consumer was back in the stores last month in a July retail sales report, headlined by a 0.6 percent monthly gain, that not only exceeds top expectations but also includes sizable upward revisions. Nonstore retailers, vehicle dealers, building materials stores lead the report — all major categories. Secondary readings are all strong: up 0.5 percent ex-autos, up 0.5 percent ex-autos ex-gas, and up 0.6 percent for the control group.
Revisions are prominent in this report with June revised 5 tenths overall to plus 0.3 percent from an initial minus 0.2 percent. And May gets an upward revision too, now unchanged vs minus 0.1 percent.
One the weakest of all the consumer readings, retail sales are now back into the fold with other indications on consumer spending, which are positive and in line with full employment. Note that the upward revisions to June and May will be positives for second-quarter GDP revisions.
This measure has flattened recently:
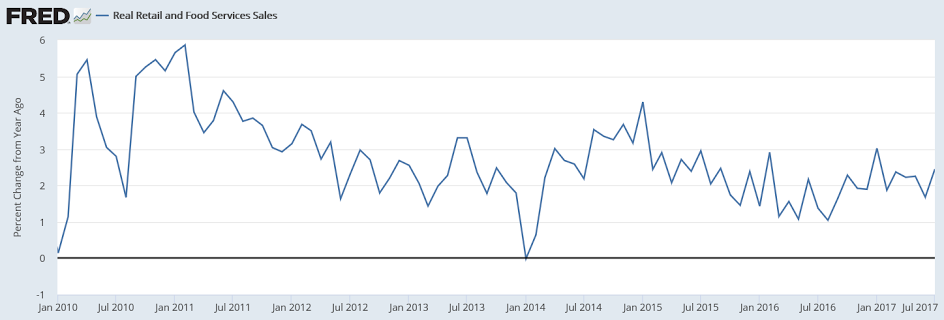
This looks to me like it’s again working its way lower:
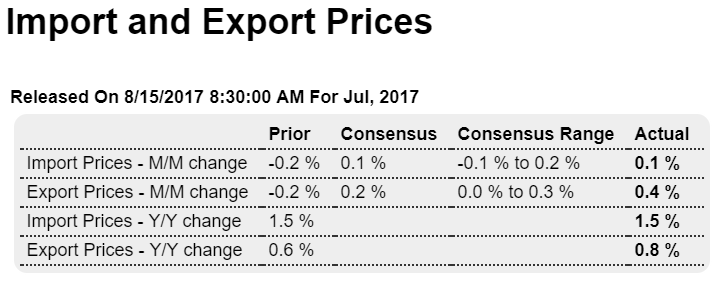
Looking like the weak $US is translating into deflation abroad rather than inflation at home:
Highlights
A boost in petroleum gave a lift to import prices while a boost from agricultural gave a boost to export prices. Import prices in July posted an as-expected 0.1 percent increase as petroleum was up 0.7 percent in the month. Outside of petroleum, however, July import prices limped in at no change. Prices of finished exports remain dead flat, at or near zero whether month-on-month or year-on-year. The yearly rate for overall imports is steady at a modest 1.5 percent.
Export prices rose a stronger-than-expected 0.4 percent with agricultural products up 2.1 percent to more than shave in half sharp declines in the two prior months. Prices for finished exports, like finished imports, are flat with consumer goods, at minus 1.7 percent year-on-year, especially weak. Total export prices are up only 0.8 percent year-on-year which is not good news for the nation’s exporters.
But what is good news for exporters is the tangible decline underway in the dollar. This points to increasing pressure for import prices which, though making them less affordable to U.S. buyers, will help the Federal Reserve in its efforts to stimulate inflation.
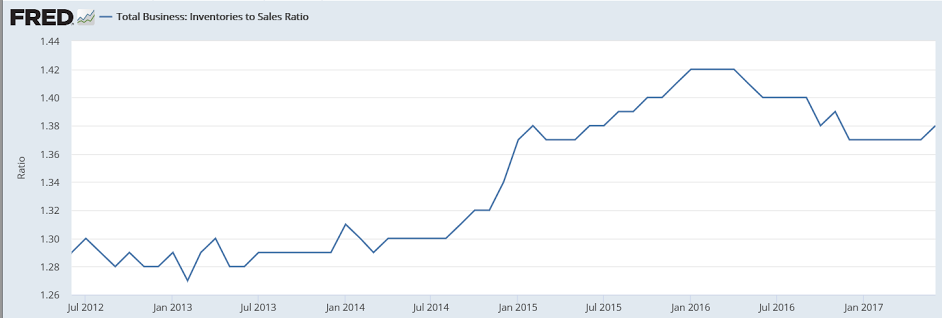
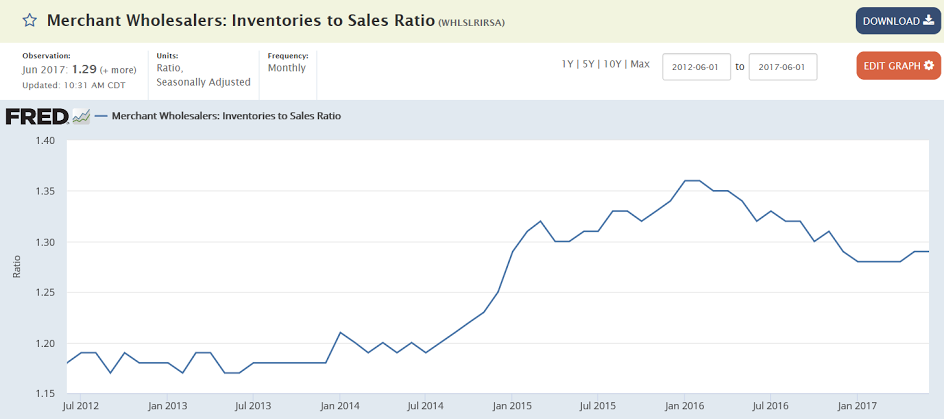
Inventories remain excessive and just grew a bit more than sales:

Highlights
After a flat start to the second quarter, businesses built up their inventories by a sharp 0.5 percent in June which beats Econoday’s consensus by 1 tenth. The build is centered in wholesale which rose 0.7 percent with inventories among retailers up 0.6 percent in June which, based on this morning’s retail sales report, is a plus going into what proved to be a very strong July for the sector. Factory inventories in June rose 0.2 percent.
In an uncertain result in the report, the rise in inventories exceeded the 0.3 percent rise in underlying sales to lift the inventory-to-sales ratio 1 tick to a less lean 1.38. This could mean that supply is exceeding demand, or however that businesses are stocking up ahead of what see as better business ahead. Note that the slightly higher-than-expected headline may give a lift to second-quarter revision estimates which are likely to get a more definitive lift from the upward revisions in today’s retail sales report.

Highlights
The housing market index joins retail sales and Empire State as major upside surprises this morning, up 4 points to 68 in August which tops Econoday’s high forecast by 2 points. This puts the index back at levels earlier this year and points to building confidence among the nation’s home builders.
Builders see gains for both present sales, up 4 points to 74, and 6-month sales, up 5 points to 78. Trailing far behind, however, and not showing much pace is traffic still under 50 at 49. Lack of traffic hints at lack of first-time buyers who appear to be getting locked out of the new home market by high prices and lack of supply on the market.
Regional composite scores show the West, a key region for builders, out in front followed by the South and Midwest which are also both very strong followed in the distance by the Northeast which is flat. This report offers an advance indication for August but won’t be hurting expectations any for tomorrow’s July housing starts and permits report where strength is the call.
