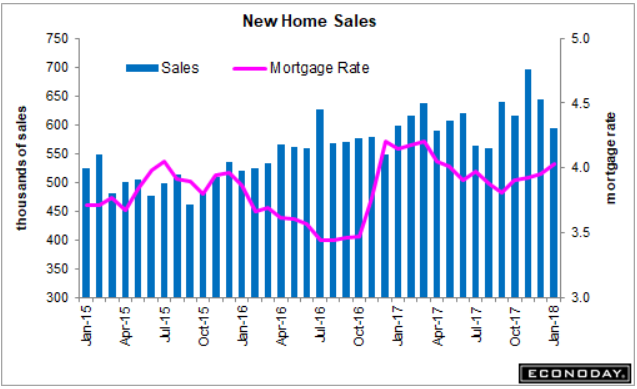
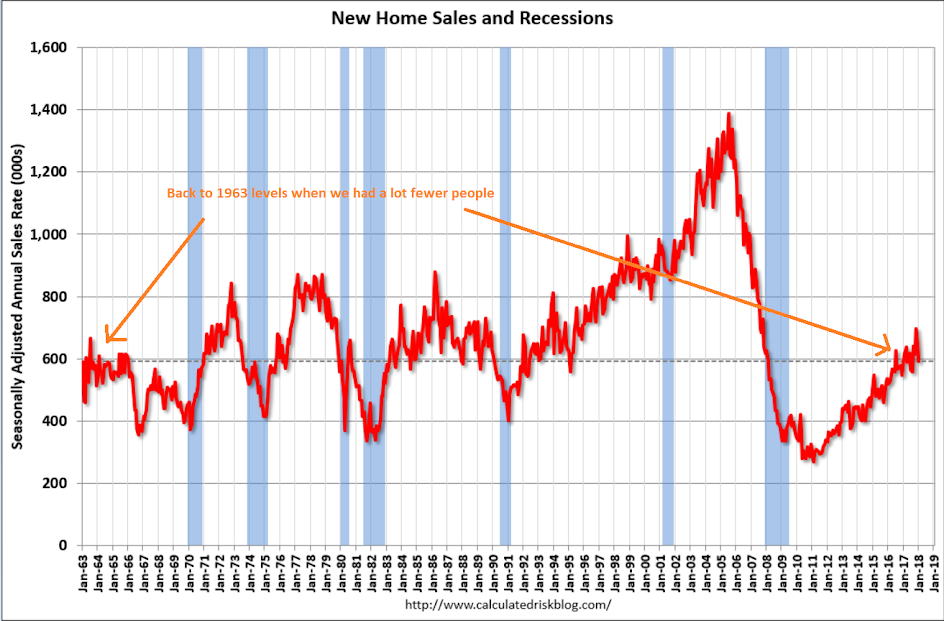
Large drop from already historically depressed levels reverses year end spike, and inline with depressed mortgage applications: Highlights Sales of new homes slowed but not all the data in January’s new home sales report are negative. New home sales came in at a much lower-than-expected 593,000 annualized rate in January though, in offsets, the two prior months are revised a net 25,000 higher. And badly needed supply moved into the market, up a monthly 2.4 percent to 301,000 units for sale. On a sales basis, supply jumped above 6 months to 6.1 months vs 5.5 and 4.9 months in the two prior months. But sales in January were definitely soft as the rate in the South, which is by far the largest housing region, fell 14.2 percent to a 301,000 rate with the Northeast, which had
Topics:
WARREN MOSLER considers the following as important: Uncategorized
This could be interesting, too:
tom writes The Ukraine war and Europe’s deepening march of folly
Stavros Mavroudeas writes CfP of Marxist Macroeconomic Modelling workgroup – 18th WAPE Forum, Istanbul August 6-8, 2025
Lars Pålsson Syll writes The pretence-of-knowledge syndrome
Dean Baker writes Crypto and Donald Trump’s strategic baseball card reserve
Large drop from already historically depressed levels reverses year end spike, and inline with depressed mortgage applications:

Highlights
Sales of new homes slowed but not all the data in January’s new home sales report are negative. New home sales came in at a much lower-than-expected 593,000 annualized rate in January though, in offsets, the two prior months are revised a net 25,000 higher. And badly needed supply moved into the market, up a monthly 2.4 percent to 301,000 units for sale. On a sales basis, supply jumped above 6 months to 6.1 months vs 5.5 and 4.9 months in the two prior months.
But sales in January were definitely soft as the rate in the South, which is by far the largest housing region, fell 14.2 percent to a 301,000 rate with the Northeast, which had been coming on strong, down 33.3 percent to only a 24,000 rate. Year-on-year, sales in the West are doing best at plus 33.1 percent with the South down, however, a steep 10.9 percent. Overall, new home sales are down a yearly 1.0 percent.
Prices are another negative in the report, down 4.1 percent for the median to $323,000 though the yearly rate is still positive at 2.5 percent.
The new home market surged into the end of last year but understandably slowed in January. Yet supply, that is the lack of it, is an overwhelming issue for the market and today’s details, including gains underway for permits and starts which are growing in the mid-to-high single digits, are positives for the outlook.


White House Legal Team Considers Ways Trump Could Testify Before Mueller
President Donald Trump’s lawyers are considering ways for him to testify before special counsel Robert Mueller, provided the questions he faces are limited in scope and don’t test his recollections in ways that amount to a potential perjury trap, a person familiar with his legal team’s thinking said. Mr. Trump’s legal team is weighing options that include providing written answers to Mr. Mueller’s questions and having the president give limited verbal testimony, another person familiar with the matter said. “Everything is on the table,” this person said.
