More signs of a slowdown as exports fall, which means less gdp, and consumer imports down, meaning personal spending was lower than expected, as discussed might be the case previously due to lower personal income growth: Highlights Exports came back sharply in January to feed an oversized .4 billion goods deficit in January, in what starts off another quarter of trouble for net exports and GDP. Exports fell 2.2 percent in the month with capital goods and industrial supplies posting sharp declines and easily offsetting a sizable gain for the smaller category of consumer goods. Imports also fell but much less so, down 0.5 percent with imports of consumer goods, which on this side of the ledger is the largest category, down 2.2 percent. Imports of capital goods were
Topics:
WARREN MOSLER considers the following as important: Uncategorized
This could be interesting, too:
tom writes The Ukraine war and Europe’s deepening march of folly
Stavros Mavroudeas writes CfP of Marxist Macroeconomic Modelling workgroup – 18th WAPE Forum, Istanbul August 6-8, 2025
Lars Pålsson Syll writes The pretence-of-knowledge syndrome
Dean Baker writes Crypto and Donald Trump’s strategic baseball card reserve
More signs of a slowdown as exports fall, which means less gdp, and consumer imports down, meaning personal spending was lower than expected, as discussed might be the case previously due to lower personal income growth:

Highlights
Exports came back sharply in January to feed an oversized $74.4 billion goods deficit in January, in what starts off another quarter of trouble for net exports and GDP. Exports fell 2.2 percent in the month with capital goods and industrial supplies posting sharp declines and easily offsetting a sizable gain for the smaller category of consumer goods. Imports also fell but much less so, down 0.5 percent with imports of consumer goods, which on this side of the ledger is the largest category, down 2.2 percent. Imports of capital goods were also down. Today’s report points to a beginning-of-the-year slowing for cross-border trade and a slowing lopsided against exports.
Same here- lower than expected and at odds with the ‘surveys’ that show what I’ve called ‘trumped up expectations’:

Highlights
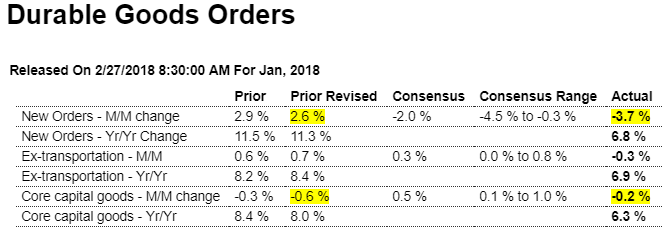
The major indications on the factory sector are mixed for January with more signs of moderation than acceleration in today’s durable goods report. Total orders sank a sharp 3.7 percent reflecting more than a give back for aircraft orders as the ex-transportation reading dipped an unexpected 0.3 percent. Unfortunately capital goods are part of the weakness, with core orders (nondefense ex-aircraft) down 0.2 percent in January following December’s 0.6 percent decline.
Total shipments are another point of softness, up only 0.2 percent to begin the first quarter off slowly. And shipments of core capital goods, which are inputs into GDP business investment, begin the quarter with only a 0.1 percent gain. Total unfilled orders are another negative, down 0.3 percent and aside from a 0.6 percent gain in December are extending a surprisingly flat trend. One positive is inventory growth, up 0.3 percent and together with gains for this morning’s wholesale and retail inventories (released separately) are pointing to a quick start for first-quarter inventories.
But like the previously released industrial production report, a quick start isn’t what the factory sector is showing and this despite all the enormous strength underway in private and regional surveys like yesterday’s Dallas Fed data or last month’s ISM report. Year-on-year growth rates in today’s report underscore the slowing, moving down from the low double digits/high single digits to the 6 percent range. Like housing, the factory sector appears to be slowing following last year’s rush at year end.
This is one of those ‘trumped up’ surveys that are at odds with the hard data:

Highlights
Market volatility or not, new long-term highs are the continuing story of the consumer confidence index which jumped to 130.8 in February to easily beat Econoday’s consensus and also top the high estimate. Only 14.7 percent of the sample say jobs are currently hard to get which is down noticeably from 16.3 percent in January and points to acceleration for the February employment report. The sample’s outlook for the labor market also continues to rise with 21.6 percent, nearly 3 percentage points higher than January, seeing more jobs opening up six months from now.
Market gyrations however are taking their toll on the sample’s bullishness with only 41.3 percent now seeing stocks moving higher over the next six months for a nearly 10 point monthly decline. The bears are now at 27.4 percent, which is up nearly 7 points.
Inflation expectations are up 1 tenth to 4.7 percent which, however, is very subdued for this reading. A look at component readings shows similar strength between the present assessment and the future outlook, at 162.4 for a 7.7 point gain and 109.7 for a 5.7 point gain, respectively.
Enormous strength in consumer confidence has been a standout feature of the economic data, in some contrast however with consumer spending where strength has been tangible but more limited. If the stock market begins to calm down, it will be interesting to see whether this report actually begins to accelerate further. Watch on Friday for final February consumer sentiment data which, though running less hot than this report, did jump sharply at mid-month.
And here’s another survey:

Highlights
After slower growth in the previous two months, manufacturing activity in the Fifth District showed renewed robust growth in February, with the Richmond Fed Manufacturing Index jumping from January’s 14 to 28, the second highest value on record. Far surpassing consensus analysts’ expectations calling for a modest increase of 2 points, the sharp acceleration in the sixteenth consecutive monthly expansion of manufacturing in the Fifth District was driven by increases in shipments, up 16 points to 31, new orders, up 11 points to 27, and the number of employees, up 15 points to 25.
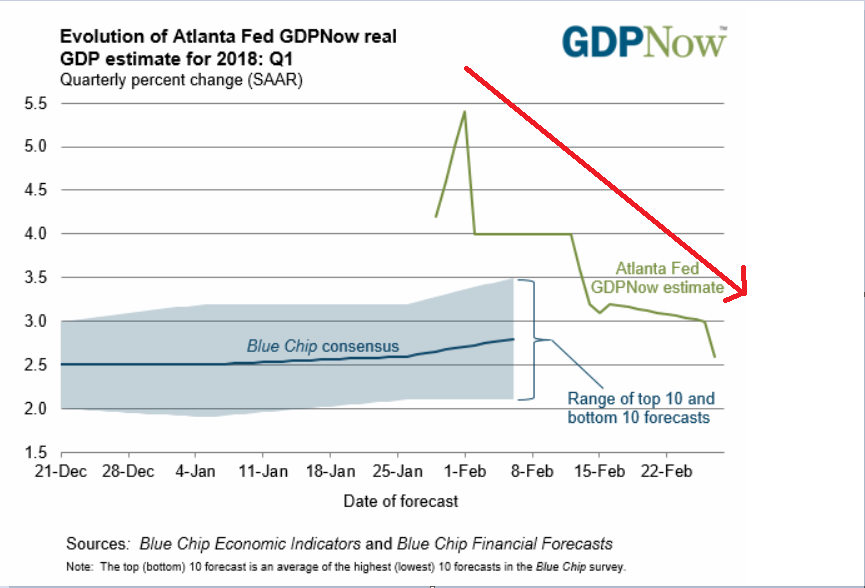
Note how this has been coming down as weak hard data is released. However it’s also being propped up by survey data:


