Heading lower from already depressed levels: Highlights The headline shows a decline but the message from the July new home sales report is nevertheless mostly positive. New home sales slipped 1.7 percent in the month to a 627,000 annualized rate that misses Econoday’s consensus by 22,000 and the Econoday’s low estimate by 3,000. Revisions are neutral with June revised 7,000 higher to 638,000 but with May revised 12,000 lower to 654,000. Now the good news. Supply moved into the market, up 2.0 percent to 309,000 new homes for sale which is the best showing since 2009. More homes for sale gives buyers more choices in what will be a likely positive for sales in the coming months. Relative to sales, supply is at 5.9 months vs 5.7 and 5.5 in the two prior months. Another
Topics:
WARREN MOSLER considers the following as important: Economic Releases
This could be interesting, too:
WARREN MOSLER writes Consumer sentiment, real retail sales, industrial production, wages
WARREN MOSLER writes New manufacturers orders, vehicle sales, unemployment claims, rents, oil prices
WARREN MOSLER writes Saudi price hike, private payrolls, new hires, corporate profits
WARREN MOSLER writes Pending home sales, Durable goods orders, oil rigs and production
Heading lower from already depressed levels:

Highlights
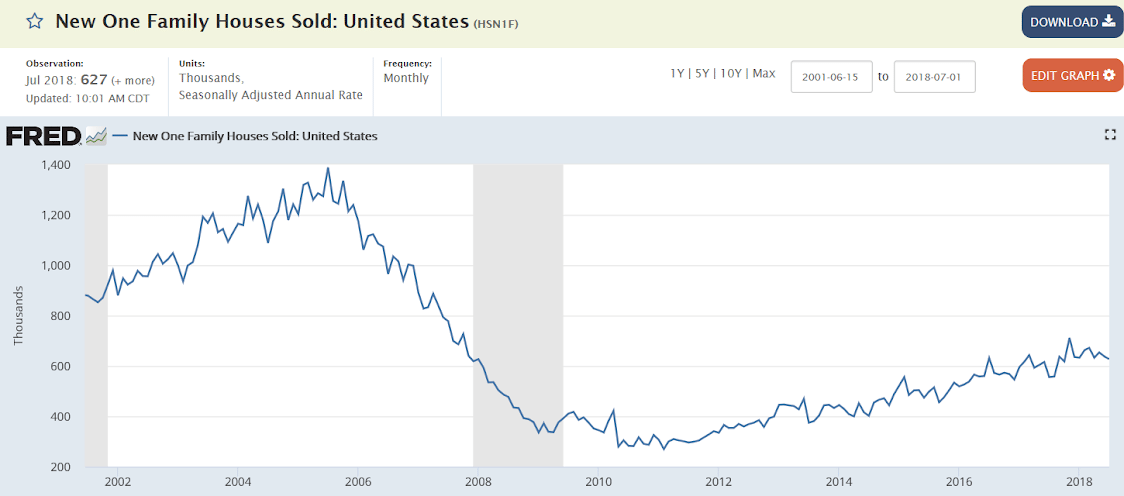
The headline shows a decline but the message from the July new home sales report is nevertheless mostly positive. New home sales slipped 1.7 percent in the month to a 627,000 annualized rate that misses Econoday’s consensus by 22,000 and the Econoday’s low estimate by 3,000. Revisions are neutral with June revised 7,000 higher to 638,000 but with May revised 12,000 lower to 654,000.
Now the good news. Supply moved into the market, up 2.0 percent to 309,000 new homes for sale which is the best showing since 2009. More homes for sale gives buyers more choices in what will be a likely positive for sales in the coming months. Relative to sales, supply is at 5.9 months vs 5.7 and 5.5 in the two prior months.
Another positive is a rise in prices, up a sharp 6.0 percent on the month to a median $328,700 for what is still, however, a modest 1.8 percent year-on-year increase.
Regional data show both the West and Midwest posting strong monthly gains with yearly rates at 18.5 percent and 18.2 percent respectively. The yearly rate for the South is at 17.2 percent with, however, the Northeast, which is by far the smallest region for new housing, down nearly 50 percent.
The overall year-on-year rate of growth is at 12.8 percent which if sustained would point to a badly needed uplift for the housing sector in general going into the second-half of what has been a very subdued 2018.


Highlights
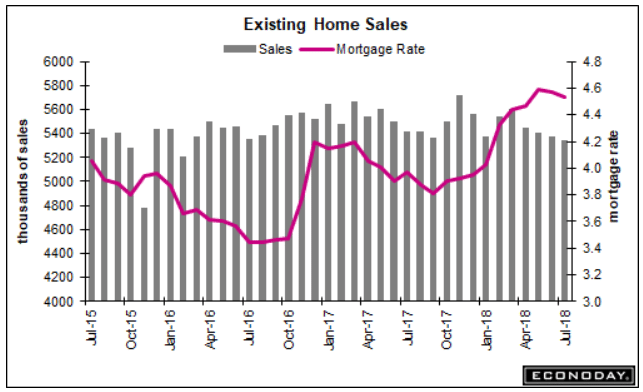
Housing is the one sector of the economy not showing any life. Existing home sales managed only a 5.340 million annualized rate in July, missing Econoday’s consensus of 5.420 million for a 0.7 percent dip from June and the fourth decline in a row. This is the lowest rate in 2-1/2 years. Year-on-year, resales are down 1.5 percent.
Both single-family homes and condos show similar weakness, the former down 0.2 percent on the month and down 1.2 percent on the year at a 4.750 million rate. Condo resales, at a 590,000 rate, fell 4.8 percent on the month and are down 3.3 percent on the year. All regions show similar declines on the year with the West posting the only monthly gain in July, at 4.4 percent.
Supply doesn’t offer any relief either, down 0.5 percent to 1.920 million total resales on the market. Relative to sales, supply is unchanged at 4.3 months. And prices fell in the month, down a monthly 1.5 percent to $269,600 for a 4.5 percent yearly gain that stands in contrast to the yearly decline in sales in a comparison that doesn’t point to price traction ahead.
Rising mortgage rates aren’t a plus for housing and neither are construction constraints for labor and materials that are slowing the new home market where weakness bleeds into resales. Third-quarter GDP looks to be very solid but apparently won’t be getting much lift from residential investment.

Home Sales Tumbled In July for the Longest Slump Since 2013
(WSJ) Existing-home sales fell 0.7% in July from June to a seasonally adjusted annual rate of 5.34 million units. That marked the fourth straight month of declines. Compared with a year earlier, sales in July were down 1.5%. The average interest rate on a 30-year fixed-rate mortgage in July was 4.53%, up from 4.03% in January and 3.97% in July 2017, according to Freddie Mac. Sales of homes at the low end of the price spectrum—priced at less than $100,000—fell nearly 11% from July 2017. Sales of homes priced $1 million or more, by comparison, rose 16%.

The July year-over-year export counts were weaker than last month – and imports are now showing a declining trend line.
