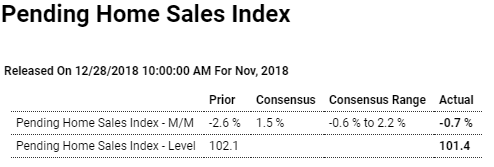
Bad: Highlights Existing home sales have been leveling but the signal from pending home sales points to a new downturn. The pending home sales index for November fell 0.7 percent to 101.4 which is under Econoday’s consensus range and compared to expectations for a 1.5 percent gain. Year-on-year this index is down 7.7 percent vs a 7.0 percent decline in final sales of existing homes. Pending sales in November posted low single-digit contraction in both the South and Midwest to offset low single-digit gains in Northeast and West. Pending sales take one to two months to close with today’s report offering advance indications for final resales in December and January. The Pending Home Sales Index, a forward-looking indicator based on contract signings, decreased 0.7 percent to
Topics:
WARREN MOSLER considers the following as important: Economic Releases
This could be interesting, too:
WARREN MOSLER writes Consumer sentiment, real retail sales, industrial production, wages
WARREN MOSLER writes New manufacturers orders, vehicle sales, unemployment claims, rents, oil prices
WARREN MOSLER writes Saudi price hike, private payrolls, new hires, corporate profits
WARREN MOSLER writes Pending home sales, Durable goods orders, oil rigs and production
Bad:

Highlights
Existing home sales have been leveling but the signal from pending home sales points to a new downturn. The pending home sales index for November fell 0.7 percent to 101.4 which is under Econoday’s consensus range and compared to expectations for a 1.5 percent gain. Year-on-year this index is down 7.7 percent vs a 7.0 percent decline in final sales of existing homes.
Pending sales in November posted low single-digit contraction in both the South and Midwest to offset low single-digit gains in Northeast and West. Pending sales take one to two months to close with today’s report offering advance indications for final resales in December and January.
The Pending Home Sales Index, a forward-looking indicator based on contract signings, decreased 0.7 percent to 101.4 in November, down from 102.1 in October. However, year-over-year contract signings dropped 7.7 percent, making this the eleventh straight month of annual decreases.
Read more at https://www.calculatedriskblog.com/#hHG97tpYkWwFYF4R.99
More surveys fading fast:

Highlights
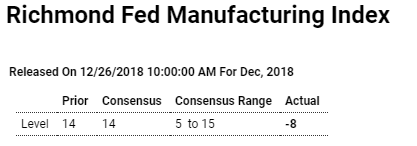
Manufacturing activity in the Fifth District contracted in December, with the Richmond Fed Manufacturing Index declining sharply by 22 points to minus 8, a negative surprise to analysts whose consensus forecasts called for an unchanged reading. The decline was driven by a 37-point drop in shipments to minus 25, the lowest reading since April 2009, and a decline of 26 points to minus 9 in the volume of new orders. Respondents also reported a sharp 30-point deterioration in local business conditions to minus 25, the lowest reading on record for the survey.
Also falling into contraction was the backlog of orders, which was down 33 points to minus 18, and capacity utilization, down 25 points to minus 16. Vendor lead times remained in expansion territory but also declined sharply by 21 points to 14.
Bucking the downtrend and shoring up the overall index were increases in inventories, with finished goods up 11 points to 13 and raw materials up 10 points to 15. Employment also provided support after weakness in the prior month, with the number of employees up 3 points to 14.
Other employment data was weaker, however, with wages down 3 points to 31, available skills down 2 points to 28 and the average workweek down 8 points to 3.
On the inflation front, prices paid rose at a 4.36 percent annualized rate, slightly less than in November but still outpacing prices received, which rose at a moderate 2.26 percent rate. Expectation over the next 6 months were for a narrowing of the gap between prices paid and prices paid rate, with prices paid slowing to a 2.90 percent annualized rate and prices received remaining about unchanged at a 2.31 percent growth rate.
First two headlines on CBNC seem a bit contradictory?

