Read More »
Bifurcation Diagram for Fluke Switch Point
Figure 1: A Bifurcation Diagram I have previously illustrated a case in which real Wicksell effects are zero. I wrote this post to present an argument that that example is not a matter of round-off error confusing me. Consider the technology illustrated in Table 1. The managers of firms know of three processes of production. These processes exhibit Constant Returns to Scale. The column for the iron industry specifies the inputs needed to produce a ton of iron. Two processes are known for...
Read More »A Fluke Switch Point With A Real Wicksell Effect Of Zero
Figure 1: A Fluke Switch Point1.0 Introduction A switch point in which the wage curves for two techniques are tangent to one another at the switch point is a fluke. Likewise, a switch point that occurs at a rate of profits of zero is a fluke. This post presents a two-commodity example with a choice between two techniques, in which the single switch point is simultaneously both types of flukes. The wage curves are tangent at the switch point, and the switch point occurs at a rate of...
Read More »Example With Four Normal Forms For Bifurcations Of Switch Points

Figure 1: A Blowup of a Bifurcation Diagram1.0 Introduction I have been working on an analysis of structural economic dynamics with a choice of technique. Technical progress can result in a variation in the switch points and the succession of techniques with wage curves on the outer wage frontier. I call such a variation a bifurcation, and I have identified normal forms for four generic bifurcations. This post prevents an example in which all four generic bifurcations appear. 2.0...
Read More »A Reswitching Bifurcation, Reflected
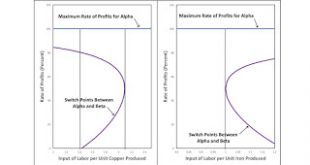
Figure 1: Two Bifurcation Diagrams Horizontally Reflecting1.0 Introduction This post continues my investigation of structural economic dynamics. I am interested in how technological progress can change the analysis of the choice of technique. I have four normal forms for how switch points can appear on or disappear from the wage frontier, as a result of changes in coefficients of production. This post concentrates on what I call a reswitching bifurcation. Each bifurcation can be...
Read More »Switch Points and Normal Forms for Bifurcations
I have put up a working paper, with the post title, on my Social Sciences Research Network (SSRN) site. Abstract: The choice of technique can be analyzed, in a circulating capital model of prices of production, by constructing the wage frontier. Switch points arise when more than one technique is cost-minimizing for a specified rate of profits. This article defines four normal forms for structural bifurcations, in which the number and sequence of switch points varies with a variation in...
Read More »Switch Points Disappearing Or Appearing Over The Axis For The Rate Of Profits
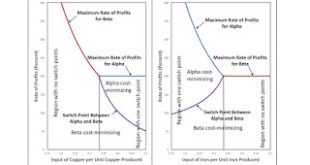
Figure 1: Two Bifurcation Diagrams Horizontally Reflecting1.0 Introduction This post continues my investigation of structural economic dynamics. I am interested in how technological progress can change the analysis of the choice of technique. In this case, I explore how a decrease in a coefficient of production can cause a switch point to appear or disappear over the axis for the rate of profits. 2.0 Technology Consider the technology illustrated in Table 1. The managers of firms know...
Read More »Bifurcations Along Wage Frontier, Reflected
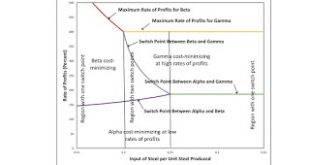
Figure 1: Bifurcation Diagram1.0 Introduction This post continues a series investigating structural economic dynamics. I think most of those who understand prices of production - say, after working through Kurz and Salvadori (1995) - understand that technical innovation can change the appearance of the wage frontier. (The wage frontier is also called the wage-rate of profits frontier and the factor-price frontier.) Changes in coefficients of production can create or destroy a reswitching...
Read More »The Choice Of Technique With Multiple And Complex Interest Rates

My article with the post title is now available on the website for the Review of Political Economy. It will be, I gather, in the October 2017 hardcopy issue. The abstract follows. Abstract: This article clarifies the relations between internal rates of return (IRR), net present value (NPV), and the analysis of the choice of technique in models of production analyzed during the Cambridge capital controversy. Multiple and possibly complex roots of polynomial equations defining the IRR are...
Read More »A Switch Point Disappearing Over The Wage Axis
Figure 1: Bifurcation Diagram1.0 Introduction In a series of posts, I have been exploring structural economic dynamics. Innovation reduces coefficients of production. Such reductions can vary the number and sequence of switch points on the wage frontier. I call such a variation a bifurcation. And I think such bifurcations, at least if only one coefficient decreases, fall into a small number of normal forms. One possibility is that a decrease in a coefficient of production results in a...
Read More »