Robert Vienneau
March 19, 2018
Post-Keynesian, Robert Vienneau: Thoughts Economics
Recurrence Of Techniques Without Switch Points
I have built on my previous post
in a writeup:
Abstract:
In certain models of commodities produced by means of commodities, the choice of technique is analyzed by the construction of the wage frontier. This article presents a numeric example of a continuum of wage curves tangent at a switch point. Technological progress leads to the recurrence of techniques. No switch points then exist, but the cost-minimizing technique varies continuously...
Read More »
Robert Vienneau
March 10, 2018
Post-Keynesian, Robert Vienneau: Thoughts Economics
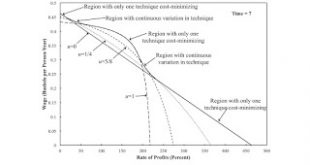
Figure 1: Switch Points Varying with Time1.0 Introduction
This post presents a perturbation of a fluke switch point.
At this switch point, the wage curves for four techniques are tangent.
In the jargon I have been inventing, this is another four-technique, local pattern.
In other words, a perturbation of appropriately selected parameters - for example,
coefficients of production - changes the sequence of wage curves and
switch points on the wage frontier. The perturbation can be viewed
as...
Read More »
Robert Vienneau
March 3, 2018
Post-Keynesian, Robert Vienneau: Thoughts Economics
I have been looking at patterns of switch points. A pattern is a configuration of switch points helpful for perturbation analysis for the
choice of technique. I am curious how the switch points and the wage curves along the wage frontier can alter with parameters,
in a model of the production of commodities. Such a parameter can be a coefficient of production; time, where a number of parameters
are functions of time; or the markup in an industry or a number of industries. A normal form...
Read More »
Robert Vienneau
March 1, 2018
Post-Keynesian, Robert Vienneau: Thoughts Economics
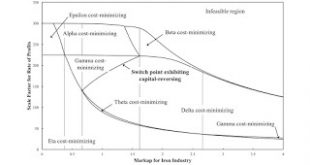
Figure 1: Variation in Switch Points with the Markup in the Iron Industry1.0 Introduction
I finally use the tools of pattern analysis that I have been inventing to tell a practical
story. I build on the example
which I began in my previous post.
Workers would be better off if an increase in wages led to greater employment, not less. A long-period change in relative markups
among industries can result in firms in some industries obtaining a greater rate of profits at the expense of firms...
Read More »
Robert Vienneau
February 23, 2018
Post-Keynesian, Robert Vienneau: Thoughts Economics
Figure 1: The Wage Frontier at a Four-Technique Patterns1.0 Introduction
This post presents another numerical example of one technique replacing another, along
the wage frontier, with a perturbation of a model parameter.
In a previous post, I identified
three sequences of patterns of switch points in which the wage curves for one technique replaces the wage curve of
another.
In one of these sequences, a three-technique pattern removes the middle technique from three techniques with
wage...
Read More »
Robert Vienneau
February 19, 2018
Post-Keynesian, Robert Vienneau: Thoughts Economics
Figure 1: One Way One Technique Can Replace Another
The wage-rate of profits frontier (or wage frontier) is calculated with prices of production, given the techniques of production,
available in the economy, for producing a given output.
Suppose at one point in time, the techniques that lie along the wage frontier consist of the Alpha, Beta, and Gamma techniques,
in order of an increasing rate of profits. As time passes, technical innovation alters coefficients of production, including
for...
Read More »
Robert Vienneau
February 15, 2018
Post-Keynesian, Robert Vienneau: Thoughts Economics
Figure 1: Wage Curves for a Reswitching Example1.0 Introduction
This post illustrates another fluke case. In this example economy, two techniques
exist for producing a net output of corn. The wage curves for the two techniques
have two switch points. One switch point is on the wage axis, corresponding to
a rate of profits of zero. The other is on the axis for the rate of profits, corresponding
to a wage of zero.
This example is a fluke in two ways. In the jargon I have been inventing,
it...
Read More »
Robert Vienneau
January 27, 2018
Post-Keynesian, Robert Vienneau: Thoughts Economics
Figure 1: Partition of the Parameter Space1.0 Introduction
I here provide some notes on a perturbation of an example from Salvadori and Steedman (1988).
Consider an economy in which n commodities are produced in n industries.
In each industry, a single commodity is produced from inputs of labor and the services of previously produced capital goods.
Suppose the technology can be represented in each industry by a continuously-differentiable production function.
The wage-rate of profits...
Read More »
Robert Vienneau
January 15, 2018
Post-Keynesian, Robert Vienneau: Thoughts Economics
I claim that the pattern analysis I have defined can be used to generate additional fluke switch points. I am particularly
interested in switch points that are flukes in more than one way (local patterns of co-dimension higher than one) and
fluke switch points that are combined with other fluke switch points or some aspect of other switch points (global patterns).
I have already generated some examples, not always with pattern analysis.
Fluke switch points of higher co-dimension
A switch...
Read More »
Robert Vienneau
January 8, 2018
Post-Keynesian, Robert Vienneau: Thoughts Economics
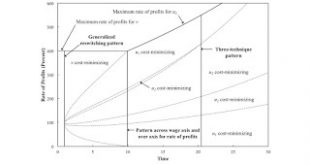
Figure 1: Variation of Switch Points with Time1.0 Introduction
This post presents another local pattern of co-dimension one. I have conjectured that only four types of local patterns of
co-dimension one exist (a reswitching pattern, a three-technique pattern, a pattern across the wage axis, and
a pattern over the axis for the rate of profits). In this conjecture, I meant to implicitly limit the rate of profits
at which switch points occur to be non-negative and not exceeding the maximum...
Read More »