Gas prices sound a consumer warning I got a note yesterday from a fellow forecaster pointing out that crude oil prices have once again made new 7 year highs. This is something I also highlighted in my “Weekly Indicators” column on Saturday. As I write this on Wednesday morning, West Texas Intermediate Crude trades at slightly under /barrel, yet another new 7+ year high. How much trouble does this portend for the economy? Potentially, a lot.Prof. James Hamilton (of Econbrowser) pointed out over a decade ago that big increases in gas prices had preceded 10 of the 11 recessions in the US since the end of World War 2. Although I can’t find the article right now, my recollection is that Hamilton’s model is calibrated to gas prices to spiking to a
Topics:
NewDealdemocrat considers the following as important: gas prices, US EConomics, US/Global Economics
This could be interesting, too:
NewDealdemocrat writes JOLTS revisions from Yesterday’s Report
Bill Haskell writes The North American Automobile Industry Waits for Trump and the Gov. to Act
Bill Haskell writes Families Struggle Paying for Child Care While Working
Joel Eissenberg writes Time for Senate Dems to stand up against Trump/Musk
Gas prices sound a consumer warning
I got a note yesterday from a fellow forecaster pointing out that crude oil prices have once again made new 7 year highs. This is something I also highlighted in my “Weekly Indicators” column on Saturday. As I write this on Wednesday morning, West Texas Intermediate Crude trades at slightly under $90/barrel, yet another new 7+ year high.
How much trouble does this portend for the economy? Potentially, a lot.
Prof. James Hamilton (of Econbrowser) pointed out over a decade ago that big increases in gas prices had preceded 10 of the 11 recessions in the US since the end of World War 2. Although I can’t find the article right now, my recollection is that Hamilton’s model is calibrated to gas prices to spiking to a new all-time high. Obviously, at about $3.40/gallon right now, we’re nowhere near 2008’s $4.25/gallon, when average hourly wages were 33% lower than they are now.
But it strikes me that the model shouldn’t *require* new all-time highs. Suppose prices had been $2/gallon for 20 years, and then rose to $3/gallon suddenly? That obviously would be nowhere near a new all-time high, but many consumers would long ago have come to accept $2 as the “normal” price, and probably would react almost as strongly as if prices had made a new high.
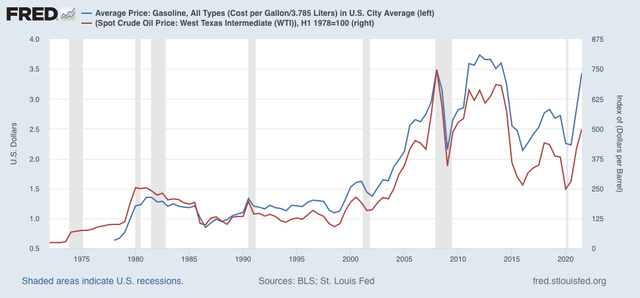
So I went back and calculated current gas prices now, and in the half-year coinciding with past recessions vs. the 5 year previous average of prices. Before I show you how that came out, let’s look at a historical graph.
Gas prices have been published only since 1978. In order to include the oil shocks of 1974 and 1979, we need to use oil prices, the records of which go back to World War 2 and before. Here’s what the semiannual prices of each look like:

When we compare gas prices in the 6 months just before past recessions vs. their 5 year previous average, here’s what we get:
1990: $1.33 vs. $1.01, up 32%
2000: $1.48 vs. $1.13, up 31%2008: $3.45 vs. $2.21, up 52%
We don’t have 5 full years of gas prices before 1980, but using the data from its beginning in January 1878, we get:
1980: $1.27 vs. $0.74, up 71%
Since we can see from oil prices that gas prices were on par or even lower than 1978 during the 3 previous years, the shock in 1980 would be higher than 71% (from personal recollection, gas prices doubled or more after the 1979 oil shock started, which is also what they did in 1974).
Now let’s look at the current comparison:
2021: $3.25 vs. $2.53, up 28%
January 2022 vs. previous 5 years: $3.32 vs. $2.58, up 28%
The current increase of 28% compared with the previous 5 years is very close to the 30%+ that coincided with the onset of previous recessions. It’s important to point out in that regard that the 1990 recession just barely coincided with a new all-time high, since at $1.33, they were only $.04 higher than 1980’s $1.27.
Generally, the way we would expect gas prices to trigger a consumer recession is by consumers cutting back on non-gas purchases, perhaps even to a greater amount than the added $$ spent on gas. The below two graphs show that two ways.
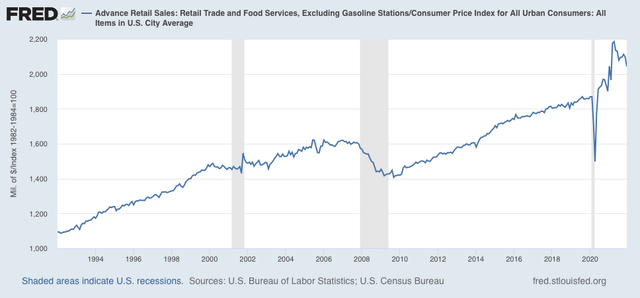
First, here are retail sales ex-gasoline adjusted for the overall consumer price index (note this series only begins in 1994):

Non-gas purchases turned flat in the year just before both the 2001 and 2008 recessions. They didn’t do that for the sui generis pandemic recession.
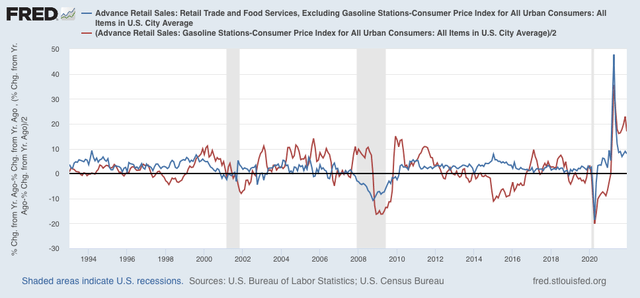
Next, here is the YoY% change comparison between non-gas (blue) and gas (red, /2 for scale) purchases:

Before both the 2001 and 2008 recessions, YoY non-gas purchases, adjusted for inflation, were down, while gas purchases YoY were still higher.
At the moment, both are still significantly higher YoY. But that is going to change drastically starting in March, with the comparisons against last spring’s stimulus-fueled spending.
Just one indicator, and none of my indicator arrays are forecasting recession this spring. But they are forecasting a slowdown by summer, so at very least if gas prices remain at these *relatively* high levels, or increase further, I expect significant consumer distress to show up.
