Negative May and YoY real retail sales add to the foreboding signals of a recession next year Nominal retail sales for the month of May declined -0.3%, and April was revised down by -0.2% to +0.7%. This reduces April’s number, after inflation to +0.4%, followed by a “real” decline in May of -1.2% after rounding. YoY real retail sales were up 8.1%, but because inflation in the past 12 months has been 8.5%, real retail sales YoY is down -0.4%. Here is a graph of the absolute value of real retail sales: In the past 75 years, a decline in real retail sales YoY has frequently – but not always – indicated a recession. Here’s what the past 30 years look like: Needless to say, not good news. Next let’s turn to employment, because real retail
Topics:
NewDealdemocrat considers the following as important: NDd, real retail sales, recession, US EConomics
This could be interesting, too:
NewDealdemocrat writes JOLTS revisions from Yesterday’s Report
Bill Haskell writes The North American Automobile Industry Waits for Trump and the Gov. to Act
Bill Haskell writes Families Struggle Paying for Child Care While Working
Joel Eissenberg writes Time for Senate Dems to stand up against Trump/Musk
Negative May and YoY real retail sales add to the foreboding signals of a recession next year
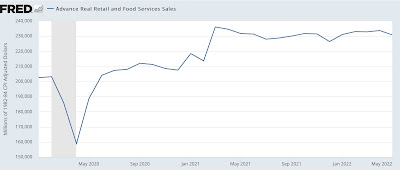
Nominal retail sales for the month of May declined -0.3%, and April was revised down by -0.2% to +0.7%. This reduces April’s number, after inflation to +0.4%, followed by a “real” decline in May of -1.2% after rounding. YoY real retail sales were up 8.1%, but because inflation in the past 12 months has been 8.5%, real retail sales YoY is down -0.4%. Here is a graph of the absolute value of real retail sales:
In the past 75 years, a decline in real retail sales YoY has frequently – but not always – indicated a recession. Here’s what the past 30 years look like:
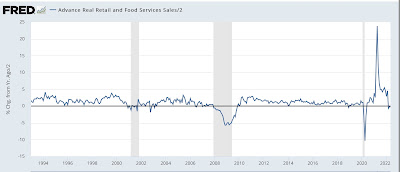
Needless to say, not good news.
Next let’s turn to employment, because real retail sales are also a good short leading indicator for jobs.
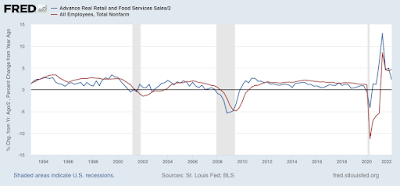
As I have written many times over the past 10+ years, real retail sales YoY/2 has a good record of leading jobs YoY with a lead time of about 3 to 6 months. That’s because demand for goods and services leads for the need to hire employees to fill that demand. The exceptions have been right after the 2001 and 2008 recessions, when it took jobs longer to catch up, as shown in the graph below, averaged quarterly through the First Quarter:
Now here is the monthly YoY comparison for the last year through May:
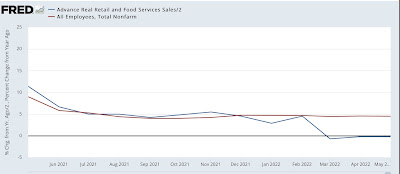
II have been writing for months that I have expected the blowout job numbers of about 500,000 per month to slow down to a range of about 100,000-300,000 per month by early autumn. The last 3 months have averaged 400,000, which has probably been the beginning of that slowdown.
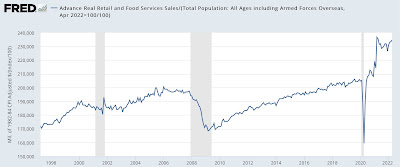
Finally, real retail sales per capita is one of my long leading indicators. Here’s what it looks like for the past 25 years:
And here is the last year:
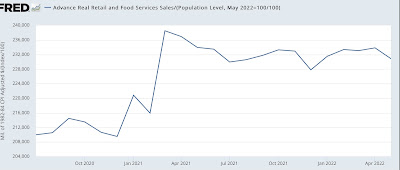
Last month’s good report temporarily switched the long leading signal from negative to neutral, but this month it goes back to negative – along with most of the rest of the long leading indicators, which have been increasingly foreboding about the economy next year.
