November existing home sales: prices have unequivocally turned down – by New Deal democrat Existing home sales do not have much actual economic impact, since the primary economic activity generated by housing is the construction. But they do help tell us a great deal about pricing. For the record, sales continued their relentless decline this year, down to 4.09 million on an annualized basis, down almost 1/3rd from their recent February peak of 6.02 million: This is in line with the 35% declines we saw yesterday in single family housing permits and the 30% decline in total permits. Only housing starts, off 20% from their peak, are “less bad.” The longer term view (note: graph only goes through September) shows that November sales were
Topics:
NewDealdemocrat considers the following as important: Hot Topics, US EConomics, US/Global Economics
This could be interesting, too:
NewDealdemocrat writes JOLTS revisions from Yesterday’s Report
Joel Eissenberg writes No Invading Allies Act
Bill Haskell writes The North American Automobile Industry Waits for Trump and the Gov. to Act
Bill Haskell writes Families Struggle Paying for Child Care While Working
November existing home sales: prices have unequivocally turned down
– by New Deal democrat
Existing home sales do not have much actual economic impact, since the primary economic activity generated by housing is the construction. But they do help tell us a great deal about pricing.
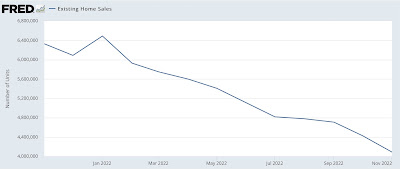
For the record, sales continued their relentless decline this year, down to 4.09 million on an annualized basis, down almost 1/3rd from their recent February peak of 6.02 million:

This is in line with the 35% declines we saw yesterday in single family housing permits and the 30% decline in total permits. Only housing starts, off 20% from their peak, are “less bad.”
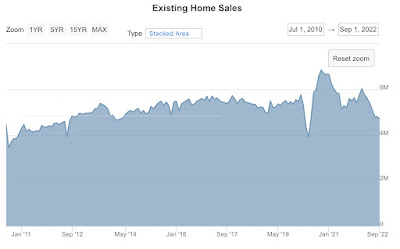
The longer term view (note: graph only goes through September) shows that November sales were the lowest since November 2010, with the exception of May 2020 and June 2012:

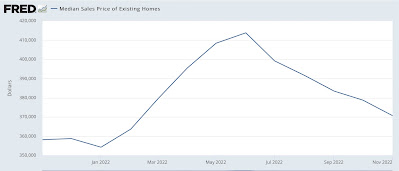
But the real importance of existing home sales is in their price signal, and here that signal was unmistakable. At $370,700 for the median existing home, prices are only up 3.5% YoY (the NAR does not seasonally adjust, so this is how we have to measure):

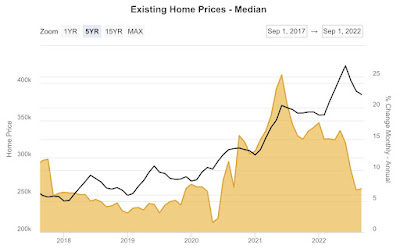
Here is a 5 year graph through September from Mortgage News Daily, showing that peak YoY appreciation within the past 12 months was 17.6% last January:

My rule of thumb is that data which can only be measured YoY has peaked when the YoY increase is less than 1/2 of its highest rate in the past 12 months. So any YoY increase of less than 8.8% would indicate a peak. Needless to say, 3.5% is well below that.
My mantra for the housing market is that sales lead prices. This year, sales turned in the Jan-Mar time frame for all of the various measures like permits, starts, and new home sales, as well as existing home sales. We now know to a virtual certainty that prices peaked at some point during the summer.
The sales data is, as I said yesterday, recessionary. But the old saw is that “the remedy for high prices, is high prices.” Now that we are seeing prices come down, the groundwork is being laid for the economic turnaround to come – the timing of which is yet to be determined.
Have new home sales made a bottom? Angry Bear angry bear blog
