Jobless claims: a good example of why my forecasting discipline demands a confirmed trend – by New Deal democrat Initial jobless claims for the last week of July rose 6,000 to 227,000. The 4 week average decreased -5,500 to 228,250. Continuing claims, with a one week lag, rose 21,000 to 1.7 million: The YoY% change is much more important for forecasting purposes. There, initial claims were up 4.1%, the 4 week average up 5.8%, and continuing claims up 25.9%: The behavior of initial claims in the past number of weeks has been an important example of why my forecasting discipline demands 2 months of continued readings higher by 12.5% or more for a valid signal. Many times in the past 50+ years there have been spikes higher than 12.5% which
Topics:
NewDealdemocrat considers the following as important: Hot Topics, jobless claims, Sahm rule, US EConomics
This could be interesting, too:
NewDealdemocrat writes JOLTS revisions from Yesterday’s Report
Joel Eissenberg writes No Invading Allies Act
Bill Haskell writes The North American Automobile Industry Waits for Trump and the Gov. to Act
Bill Haskell writes Families Struggle Paying for Child Care While Working
Jobless claims: a good example of why my forecasting discipline demands a confirmed trend
– by New Deal democrat
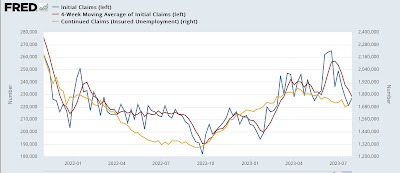
Initial jobless claims for the last week of July rose 6,000 to 227,000. The 4 week average decreased -5,500 to 228,250. Continuing claims, with a one week lag, rose 21,000 to 1.7 million:

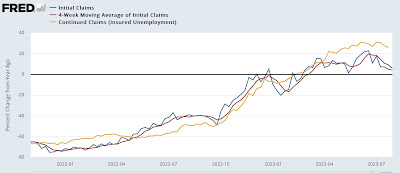
The YoY% change is much more important for forecasting purposes. There, initial claims were up 4.1%, the 4 week average up 5.8%, and continuing claims up 25.9%:

The behavior of initial claims in the past number of weeks has been an important example of why my forecasting discipline demands 2 months of continued readings higher by 12.5% or more for a valid signal. Many times in the past 50+ years there have been spikes higher than 12.5% which dissipated within 2 months, and did not correlate with an oncoming recession. Only when the increased number is durable does it create a valid red flag recession warning.
Needless to say, we had a “close but no cigar” spike in June. The downturn in cliams in July resets the clock.
Finally, especially in view of tomorrow’s jobs report, let’s update what this means for the Sahm Rule (an increase of 0.5% from the low in the 3 month average of the unemployment rate means that a recession has begun).
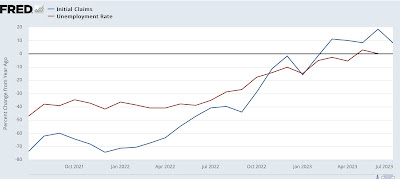
On a monthly basis, the YoY% change in new jobless claims is higher by 8.1%. Claims have been higher YoY ever since March, and – as has been the case for 50+ years – the unemployment rate (red) is following with a delay::

Note that the unemployment rate in the above graph is depicted as the % change in a percentage number. One year ago the unemployment rate was 3.5%.
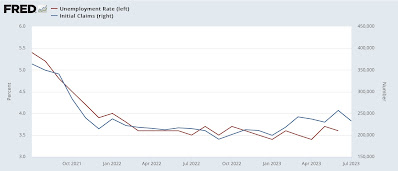
A 10% increase in the unemployment rate takes us to 3.8% or 3.9% in the coming months, as best shown in the below graph of the same information in absolute terms:

That doesn’t necessarily mean that the unemployment rate will increase month over month tomorrow, but it tells us of the underlying trend in the naar future.
As I have for many months now, I will be looking for further evidence of deceleration in job gains, wage gains, as well as evidence of the above trend in the unemployment rate in tomorrow’s report.
Continuing improvement in new jobless claims re-sets the clock, Angry Bear, New Deal democrat
