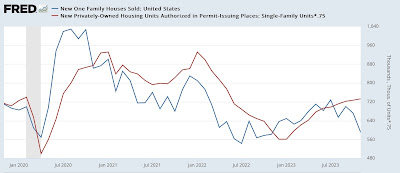
More economic news an d this time new single family housing. Completing the housing market picture for November, sales decline bigly, and prices remain down YoY – by New Deal democrat Our final important pre-year end release was also the final item of housing data for the month, new home sales. To reiterate, the value of this metric is that it is the most leading of all housing metrics. Its big drawback is that it is very noisy and heavily revised. In November, new single family home sales (blue in the graphs below) declined -82,000 annualized, or -12.2% month over month. This is in stark contrast to the much less noisy single family permits (red), which rose 0.8% to an 18 month high (note: permits *75 for scale in the graphs below):
Topics:
NewDealdemocrat considers the following as important: Hot Topics, housing, New Deal Democrat, politics, US EConomics
This could be interesting, too:
Robert Skidelsky writes Lord Skidelsky to ask His Majesty’s Government what is their policy with regard to the Ukraine war following the new policy of the government of the United States of America.
NewDealdemocrat writes JOLTS revisions from Yesterday’s Report
Joel Eissenberg writes No Invading Allies Act
Ken Melvin writes A Developed Taste
More economic news an d this time new single family housing.
Completing the housing market picture for November, sales decline bigly, and prices remain down YoY
– by New Deal democrat
Our final important pre-year end release was also the final item of housing data for the month, new home sales.
To reiterate, the value of this metric is that it is the most leading of all housing metrics. Its big drawback is that it is very noisy and heavily revised.
In November, new single family home sales (blue in the graphs below) declined -82,000 annualized, or -12.2% month over month. This is in stark contrast to the much less noisy single family permits (red), which rose 0.8% to an 18 month high (note: permits *75 for scale in the graphs below):
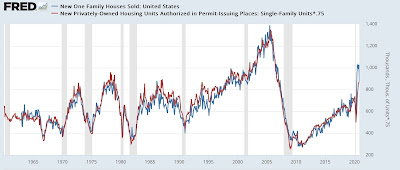
Note that sales tend to lead permits by a month or two. Over the long run they have moved almost in unison:
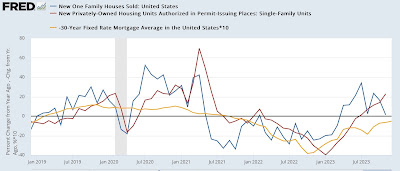
Because interest rates (gold below, inverted) lead both sales and permits, below I show all 3 YoY:
Earlier this week I noted the anomaly of permits increasing so much YoY in the face of higher interest rates. Today’s decline in sales (if not revised away next month) suggests that single family permits are going to roll over, at least temporarily, in the next few months.
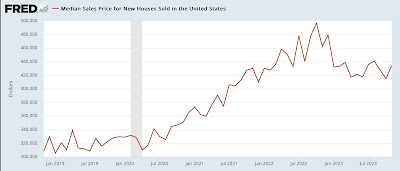
Meanwhile the median price of a new home (not seasonally adjusted) rose 19,800 in the month, but prices remain significantly below their 2022 levels:
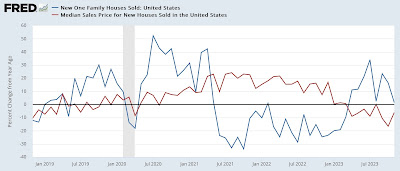
Since prices lag sales, shown on a YoY basis to deal with the seasonality, prices are down -6.0%:
This was anticipated given the decline in sales throughout 2022.
The housing market is still in the process of digesting the higher mortgage rates that prevailed all this year until November. It is no surprise that in general mortgage applications, sales, total permits, and starts remain depressed compared with levels of several years ago before the Fed started raising rates. The contrary indicator has been, as I wrote earlier this week, that the total number of housing units under construction is still levitating at near record levels.
Housing under construction continues to levitate, Angry Bear, by New Deal democrat

