An economy on autopilot between Scylla and Charybdis Interest rates are a vital determinant of longer term growth. While the economy has remained on autopilot for the last several years, with almost no political stimulus or disruption — though that may well change next month — the Fed has to steer a course between the Scylla of an interest rate spike and the Charybdis of an inverted yield curve. The Presidential election spike in long term interest rates has been enough to cause growth in the housing market, whether measured by permits, starts, new or existing home sales, to stall out. Meanwhile the several hikes in the Fed funds rate has cause a slight flattening of the yield curve. So while it is somewhat welcome that longer term interest rates have
Topics:
NewDealdemocrat considers the following as important: Featured Stories, Uncategorized
This could be interesting, too:
tom writes The Ukraine war and Europe’s deepening march of folly
Stavros Mavroudeas writes CfP of Marxist Macroeconomic Modelling workgroup – 18th WAPE Forum, Istanbul August 6-8, 2025
Lars Pålsson Syll writes The pretence-of-knowledge syndrome
Ken Melvin writes A Developed Taste
An economy on autopilot between Scylla and Charybdis
Interest rates are a vital determinant of longer term growth. While the economy has remained on autopilot for the last several years, with almost no political stimulus or disruption — though that may well change next month — the Fed has to steer a course between the Scylla of an interest rate spike and the Charybdis of an inverted yield curve. The Presidential election spike in long term interest rates has been enough to cause growth in the housing market, whether measured by permits, starts, new or existing home sales, to stall out. Meanwhile the several hikes in the Fed funds rate has cause a slight flattening of the yield curve.
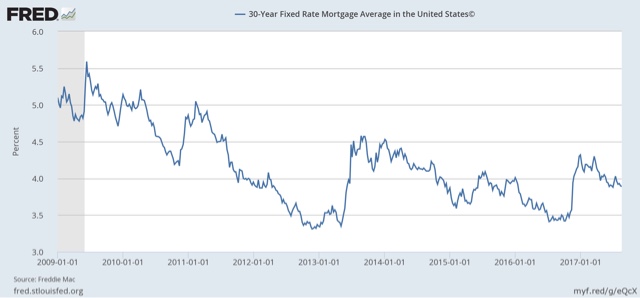
So while it is somewhat welcome that longer term interest rates have fallen back below 2.20%f and mortgage rates below 4%:
that just means that there is less of a spread between longer term and shorter term yields.
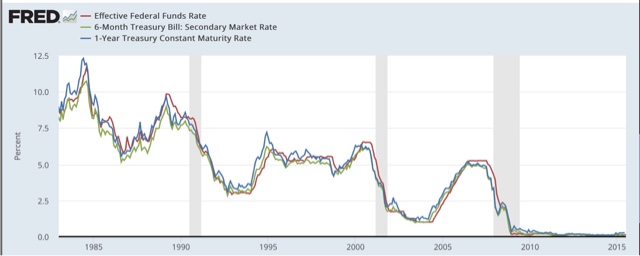
Almost any inversion in yields out further than 3 months is a warning sign. The below graph shows that 3 month rates (green) have been lower then the Fed funds rate (red) almost consistently since the early 1980s:
Meanwhile 1 year treasury yields (blue) typically only fell below the Fed funds rate later in the expansion.
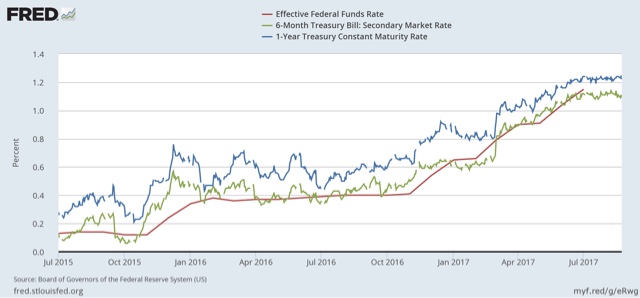
Here’s a close up on what that looks like since just before the Fed started this tightening cycle:
So far the 1 year treasury yield remains higher than the Fed funds rate, but the spread is tighter.
For now autopilot is keeping us off the rocks, but there is a significant risk of “controlled flight into terrain” before September 30. Even if we escape that, another Fed rate hike could finally create a yield curve inversion near the shorter end.


