A Day in the Life of the jobs market, May 2017 Fifty years ago, when I was a little teenybopper, his album came out and blew me away: Why bore you with this ancient Boomer reminiscence? Because the unemployment rate has only been lower than last month’s 4.3% in only six of the last 50 years, and only two of them in the last 46 years: Since February 1970, the only time the unemployment rate has been less than it is now is from 1999 into 2001. That’s not trivial. If you are under retirement age, then if you are unemployed, your odds of finding a job now are better than almost 90% of the entire time since you reached working age — or better. While we all know this isn’t the entire story, I want to take a slightly different look by starting with the U-6
Topics:
NewDealdemocrat considers the following as important: Featured Stories, US/Global Economics
This could be interesting, too:
Ken Melvin writes A Developed Taste
Joel Eissenberg writes How Tesla makes money
Angry Bear writes True pricing: effects on competition
Angry Bear writes The paradox of economic competition
A Day in the Life of the jobs market, May 2017
Fifty years ago, when I was a little teenybopper, his album came out and blew me away:
Why bore you with this ancient Boomer reminiscence?
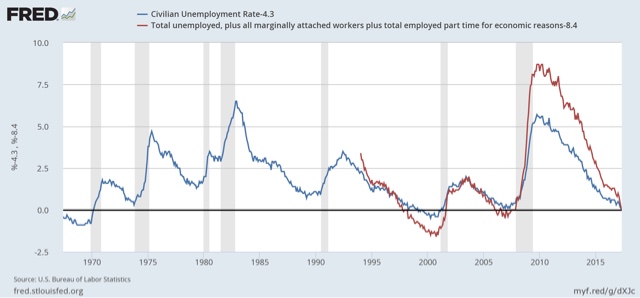
Because the unemployment rate has only been lower than last month’s 4.3% in only six of the last 50 years, and only two of them in the last 46 years:
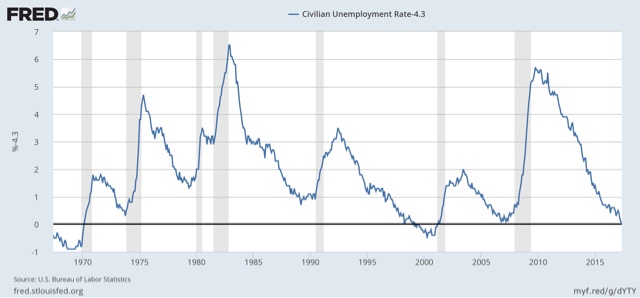
Since February 1970, the only time the unemployment rate has been less than it is now is from 1999 into 2001.
That’s not trivial. If you are under retirement age, then if you are unemployed, your odds of finding a job now are better than almost 90% of the entire time since you reached working age — or better.
While we all know this isn’t the entire story, I want to take a slightly different look by starting with the U-6 underemployment rate, and comparing the “slices” of the jobs market from there. Here are the “slices:”
- employed full time
- employed part time voluntarily
- employed part time because no full time job is available
- unemployed but looking
- not in the labor force but want a job
- not in the labor force and not interested in a job
The U6 underemployment rate in May was 8.4%. Let’s see when it has been that rate before (red in the graph below. note that most of these statistics are only available back to 1994):
The underemployment rate now is where it was in 1997 and the end of 2005.
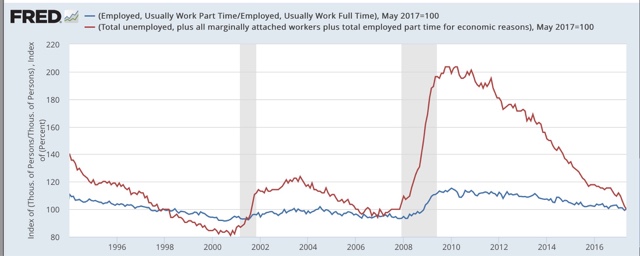
Further, the ratio of full time to part time workers (including both voluntary and involuntary part-timers) is also where it was in 1997(blue in the graph below, compared with red = U6)):
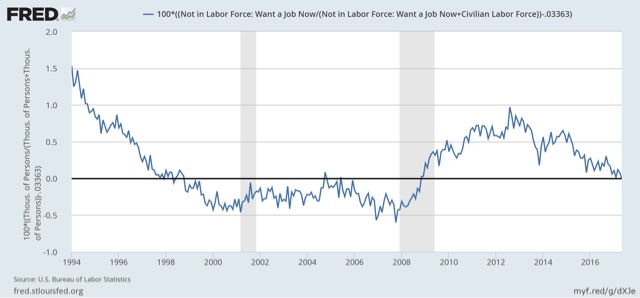
as is the proportion of those who aren’t even looking, and aren’t in the labor force, but want a job now:
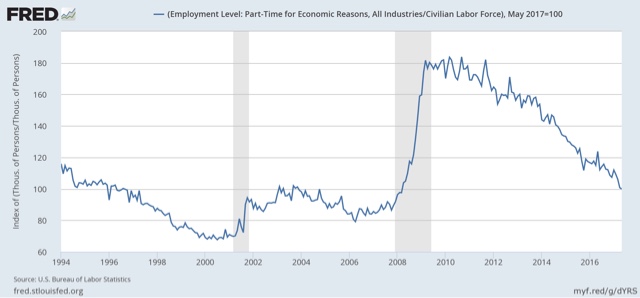
What is higher is, among those who are part-timers, the percentage of those who are so employed because they couldn’t find a full-time job:
This is more like it was in 1996.
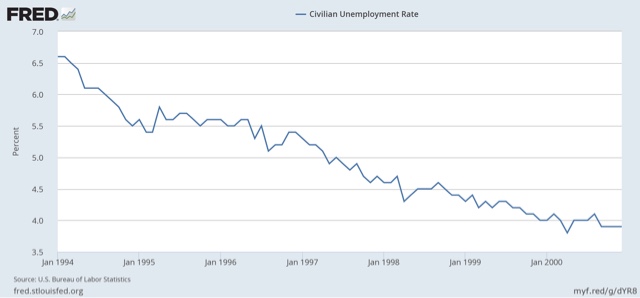
Turning to the U3 unemployment rate from the 1990s, we see that it was in the 5.0%-5.5% range in 1996, and the 4.5%-5.0% range in 1997:
The bottom line is that, when we leave aside those who tell the Census Bureau that they *aren’t* interested in working now, we see that the situation now is roughly equivalent to the time when there was a 5.0% unemployment rate in the booming 1990s economy.
On top of that, there is some number of people, mainly currently on disability, or caring for their children or parents at home, who would probably re-enter the jobs market and be interested in a job, if wages were better.
That’s a Day in the Life of the jobs market in May 2017


