Setting a baseline for a manufacturing slowdown If I am right that by roughly midyear 2019 the economy will experience a substantial slowdown, then we ought to start seeing a deceleration in the leading indicators for manufacturing soon. Additionally, if rail transportation is accurately signaling that a slowdown is already hitting due to the impact of Trump’s tariffs and China’s retaliation, producers ought to be noticing the effects almost immediately, and begin to react. Which makes me think that manufacturing new orders, as measured monthly by five of the regional Feds and also the ISM, ought to start slowing down by the end of this year. To establish a baseline, I’ve gone back and obtained the average of the five Fed regional reports (first column),
Topics:
NewDealdemocrat considers the following as important: US/Global Economics
This could be interesting, too:
Joel Eissenberg writes How Tesla makes money
Angry Bear writes True pricing: effects on competition
Angry Bear writes The paradox of economic competition
Angry Bear writes USMAC Exempts Certain Items Coming out of Mexico and Canada
Setting a baseline for a manufacturing slowdown
If I am right that by roughly midyear 2019 the economy will experience a substantial slowdown, then we ought to start seeing a deceleration in the leading indicators for manufacturing soon. Additionally, if rail transportation is accurately signaling that a slowdown is already hitting due to the impact of Trump’s tariffs and China’s retaliation, producers ought to be noticing the effects almost immediately, and begin to react.
Which makes me think that manufacturing new orders, as measured monthly by five of the regional Feds and also the ISM, ought to start slowing down by the end of this year.
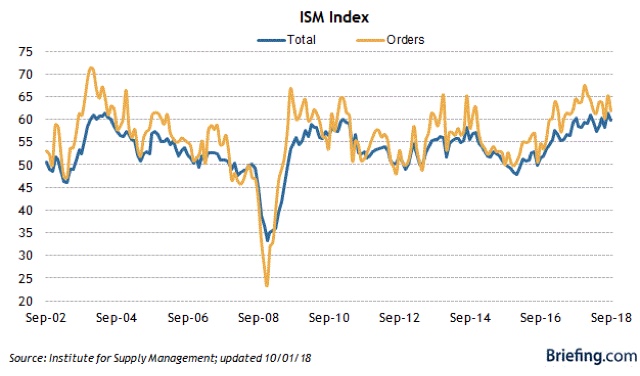
To establish a baseline, I’ve gone back and obtained the average of the five Fed regional reports (first column), and the ISM new orders index reading (second column) since the beginning of this year. Without further fanfare, here they are:
JAN 15 65.4
FEB 20 64.2
MAR 16 61.9
APR 17 61.2
MAY 28 63.7
JUN 24 63.5
JUL 24 60.2
AUG 17 65.1
SEP 20 61.8
OCT 18 N/a
The ISM Manufacturing Index, including new orders for October, will be reported Thursday morning. Here’s what it looked like through August:
Readings above 60 are particularly strong. So the first thing I am looking for is decelerating growth which will show up in a reading below 15 in the average of Regional Fed reports, and below 60 in ISM new orders.

