Summary:
Demographics, housing, and the economy
Way back during the Great Recession, I first noted that demographics were about to become a tailwind for the housing market. The argument, in its simplest terms, is that the median age of first time home buyers is about 30, and the nadir of the “baby bust” was 1973-76. That means that the demographic nadir of the population of first time home buyers who ultimately drive the market (since everybody else just moves up from one house to another) was in the 2003-06 period.
Yesterday I started looking into quantifying that tailwind. Without getting into too much detail, my suspicion is that it has amounted to an increase in the pool of potential first buyers on the order of roughly 250,000 households per year since
Topics:
NewDealdemocrat considers the following as important:
US/Global Economics
This could be interesting, too:
Joel Eissenberg writes How Tesla makes money
Angry Bear writes True pricing: effects on competition
Angry Bear writes The paradox of economic competition
Angry Bear writes USMAC Exempts Certain Items Coming out of Mexico and Canada
Way back during the Great Recession, I first noted that demographics were about to become a tailwind for the housing market. The argument, in its simplest terms, is that the median age of first time home buyers is about 30, and the nadir of the “baby bust” was 1973-76. That means that the demographic nadir of the population of first time home buyers who ultimately drive the market (since everybody else just moves up from one house to another) was in the 2003-06 period.
Yesterday I started looking into quantifying that tailwind. Without getting into too much detail, my suspicion is that it has amounted to an increase in the pool of potential first buyers on the order of roughly 250,000 households per year since 2010 — i.e., the increase of each year over the year previous, continuing year after year. That’s just a back of the envelope approximation.
Lo and behold,
Bill McBride a/k/a Calculated Risk posted on a similar subject yesterday, opining that the demographic tailwind was likely to continue for years for both housing and the economy generally, concluding that “My view is this is positive for both housing and the economy, especially in the 2020s. “Then
Mike Shedlock a/k/a Mish responded with regard to housing, opining that “On the surface, the demographic trends may appear neutral or slightly favorable…. [but] For now, and the next five years, attitudes and affordability are the key issues. They far outweigh any potential demographic benefit, if any.”
Who’s got the better argument? Because historically we’ve been around this block before, in a pretty big way. You may have heard of it: it was something called the “baby boom.”
In my opinion that history gives us a pretty definitive answer.
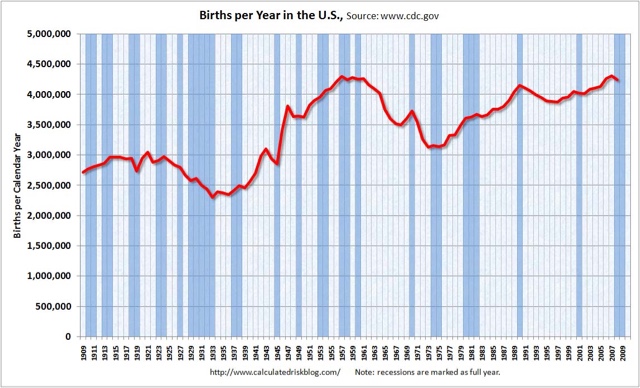
Let’s start with the demographic history. Here’s a graph of live births for each year since 1900:
Between 1900 and 1945, live births averaged about 2.75 million a year — more during the prosperous 1910s and 1920s, followed by a bust during the hard times of the 1930s.
Then, in the 20 years from 1945 to 1965, live births averaged 3.75 million a year. Officially, it has been estimated that there were 76 million “baby boomers” by the end of this period. This was a huge, huge increase unlike anything before or since over the entire 120 year period.
The US population as a whole increased from 140 million in 1945 to 195 million in 1965. The median age of the US population was 28 years old. When we consider that about 75 million of that 195 million population had been born during that period, that means that almost 40% of the entire US population were legally children (21 being age of majority at the time) in 1965!
Like I said, huge. Just huge. Even the slightly numerically larger Millennial generation, nor the post-Millennial iGeneration have come remotely near that kind of percentage.
The “baby boom” was demographically nicknamed “the bulge in the belly of the python” as will be apparent in the shape of the graphs below.
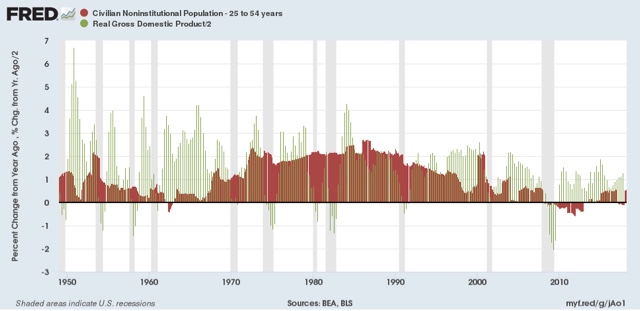
Let’s start with the economy. While I normally agree with Bill McBride, in the case of the economy in general the historical evidence from the baby boom is that demographics — at least in terms of the YoY% change in the prime working age population from ages 25-54 (red in the graphs below) is “not* well correlated with economic growth (green):
While the demographic “bulge in the belly of the beast” is indeed obvious (!), real GDP growth YoY has generally been in a persistent downtrend for the last 70 years. There is simply no evidence of economic acceleration during the period that the large Boomer demographic dominated the prime age workforce. The correlation of the economy and prime age workforce demographics is entirely an artifact of the years since 2000, and falls apart upon longer-term historical examination.
But with housing, it’s a different story entirely.
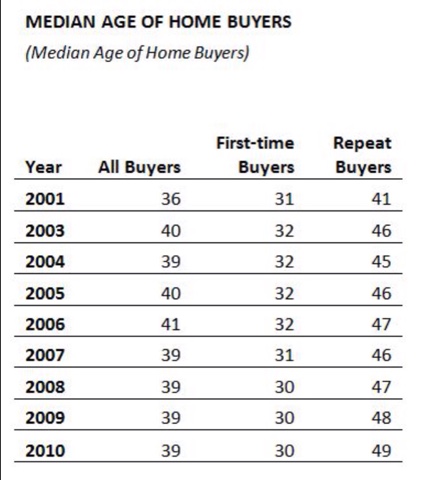
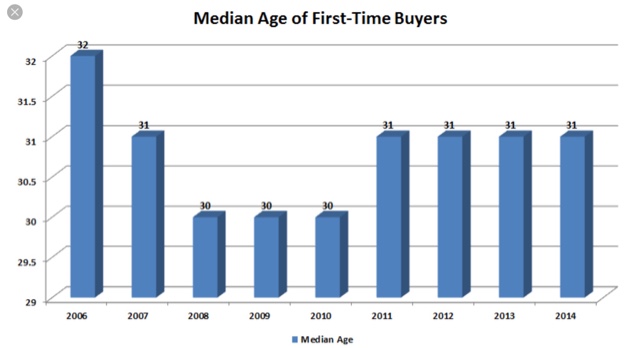
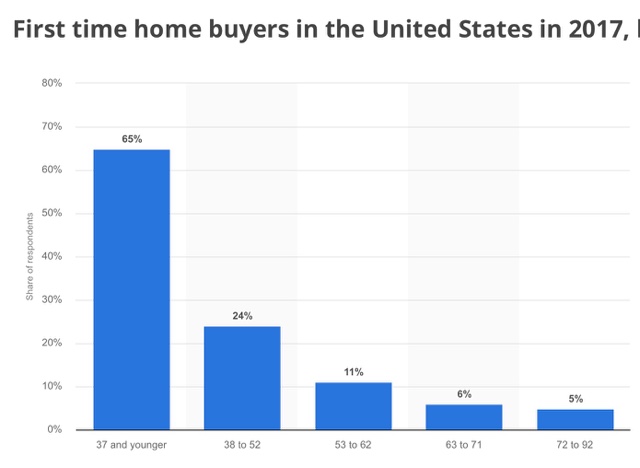
The first three graphs below are presented to show that the median age of first time home-buyers has historically been about age 30, with almost 2/3’s of all first time buyers being age 37 or lower:
g
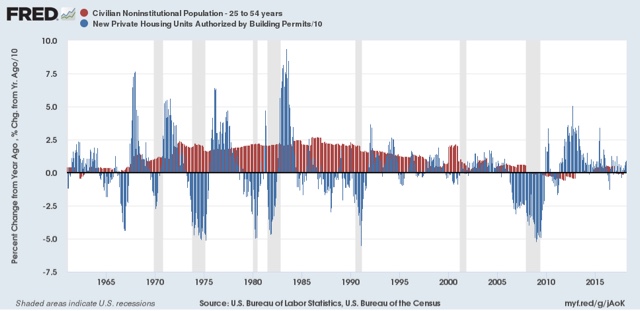
With that in mind, let’s again compare the YoY% growth in the prime age population demographic (red again) with building permits (blue, /10 for scale):
There are huge surges and declines between 1965 when the oldest Boomers reached age 20, and 1985, when the youngest did, and the oldest reached age 40.
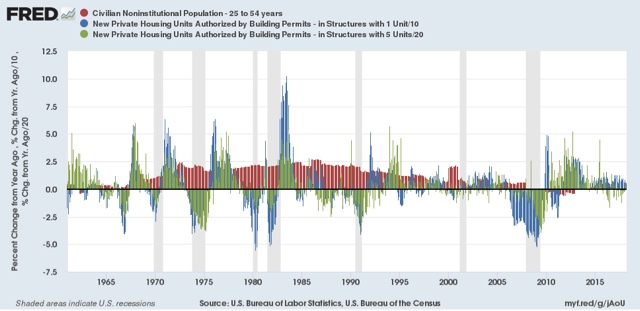
When we divide permits into those for single family houses (blue) vs. multi-unit residences (green), the progression is even clearer:
Permits for multi-unit residences surged first, beginning in 1965, as the oldest Boomers entered their 20s, while single family permits, relatively speaking, began to surge in the early 1970s, and reached their peak in the early 1980s. This is exactly what we would expect to see as the young demographic moves from apartments and condominiums into single family homes. By 1986, there gradually became more Boomers exiting the prime first time home-buying age demographic than there were younger persons entering that demographic.
Note that we’ve seen an echo of this pattern with the entry of Millennials into adulthood. During the housing bust, single family permits fared much worse than multi-unit permits, and multi-unit permits initially surged more than single family permits — but since 2010, both have surged more than at any time since 1985.
The peak in Millennial births was in 1990, after which live births leveled off. If a similar historical pattern is followed, the strong demographic tailwind in the housing market should continue through 2020, and thereafter, while not turning into a headwind, gradually subside through roughly 2025.

