October new home sales plummet — but take it with a big grain of salt As you may have already read elsewhere, new home sales plunged -8.9% in October to the seasonally adjusted annual rate of 544,000. Here’s the accompanying graph: BUT … take this with a big grain of salt. The reason I rely on building permits, espectially single family permits, is their much smaller volatility, and *much* smaller rate of revisions. To put this in context, here’s the graph from one month ago: September new home sales were originally reported at 553,000. One month later, they’ve been revised upward to 597,000! That’s an 8% upward revision. So, who’s to say what this month’s number will look like one month from now. Nevertheless, it certainly adds yet more
Topics:
NewDealdemocrat considers the following as important: Uncategorized, US/Global Economics
This could be interesting, too:
tom writes The Ukraine war and Europe’s deepening march of folly
Stavros Mavroudeas writes CfP of Marxist Macroeconomic Modelling workgroup – 18th WAPE Forum, Istanbul August 6-8, 2025
Lars Pålsson Syll writes The pretence-of-knowledge syndrome
Joel Eissenberg writes How Tesla makes money
October new home sales plummet — but take it with a big grain of salt
As you may have already read elsewhere, new home sales plunged -8.9% in October to the seasonally adjusted annual rate of 544,000. Here’s the accompanying graph:
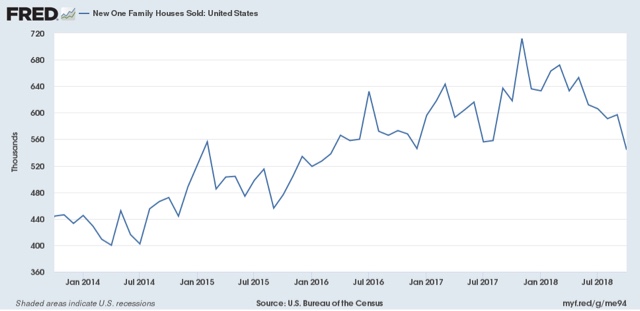
BUT … take this with a big grain of salt. The reason I rely on building permits, espectially single family permits, is their much smaller volatility, and *much* smaller rate of revisions.
To put this in context, here’s the graph from one month ago:
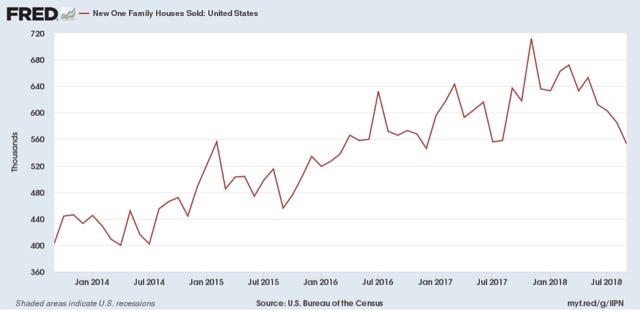
September new home sales were originally reported at 553,000. One month later, they’ve been revised upward to 597,000! That’s an 8% upward revision. So, who’s to say what this month’s number will look like one month from now.
Nevertheless, it certainly adds yet more evidence to the case that home sales have peaked for this cycle, barring a Fed reversal.