When the stock market headlines the political blogs . . . Here is a graph I saw on Digby’s blog this morning: There was also a highly-recommended, heavily-commented piece at Daily Kos. Here’s a pro tip: when you see a daily stock market move leading the political blogs, it’s a sign of a bottom, not a top. That’s because it’s a sign of emotion, and it means that amateurs are paying close attention. By the time that happens, the big move is over, or at least almost over. Even with the big drop yesterday, the S&P 500 isn’t down -10% from its recent high last month. That’s not even a “correction,” which typically happen at least once a year. We’ve had as big or bigger moves downward a number of times during this bull market, including a -20%
Topics:
NewDealdemocrat considers the following as important: politics, Taxes/regulation, US/Global Economics
This could be interesting, too:
Robert Skidelsky writes Lord Skidelsky to ask His Majesty’s Government what is their policy with regard to the Ukraine war following the new policy of the government of the United States of America.
Joel Eissenberg writes No Invading Allies Act
Ken Melvin writes A Developed Taste
Bill Haskell writes The North American Automobile Industry Waits for Trump and the Gov. to Act
When the stock market headlines the political blogs . . .
Here is a graph I saw on Digby’s blog this morning:

There was also a highly-recommended, heavily-commented piece at Daily Kos.
Here’s a pro tip: when you see a daily stock market move leading the political blogs, it’s a sign of a bottom, not a top.
That’s because it’s a sign of emotion, and it means that amateurs are paying close attention. By the time that happens, the big move is over, or at least almost over.
Even with the big drop yesterday, the S&P 500 isn’t down -10% from its recent high last month. That’s not even a “correction,” which typically happen at least once a year. We’ve had as big or bigger moves downward a number of times during this bull market, including a -20% down move in 2011.
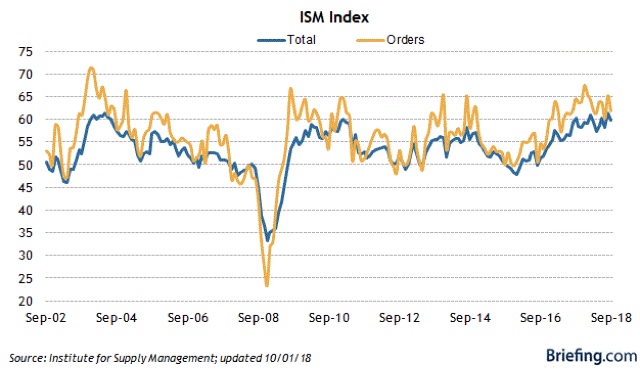
Could the market move still lower? Of course! In fact, a “re-test” of yesterday’s low is likely. But in terms of this signaling a recession in the next 3-6 months? No way. The long leading indicators haven’t turned decisively south yet, let alone other reliable short leading indicators like the ISM manufacturing surveys:
or even more reliable and less noisy, initial jobless claims:

These are well within their five year declining track, and show absolutely zero sign of stress. If they started showing up at 225,000 or higher for a few weeks, or went negative YoY, I’d start paying more attention. This morning’s report was 215,000.
Yawn.