August JOLTS report: nearly all employment measures now neutral The JOLTS report for August showed a decline in all metrics m/m as well as a slowing trend overall. To review, because this series is only 20 years old, we only have one full business cycle to compare. During the 2000s expansion: Hires peaked first, from December 2004 through September 2005 Quits peaked next, in September 2005 Layoffs and Discharges peaked next, from October 2005 through September 2006 Openings peaked last, in April 2007 as shown in the below graph (quarterly, normed to 100 as of May 2018): Here is the close-up on the past five years (monthly): As you can see, in today’s report all four metrics declined. Job openings have completely rolled over, and both quits and
Topics:
NewDealdemocrat considers the following as important: Hot Topics, US/Global Economics
This could be interesting, too:
NewDealdemocrat writes JOLTS revisions from Yesterday’s Report
Joel Eissenberg writes No Invading Allies Act
Joel Eissenberg writes How Tesla makes money
NewDealdemocrat writes January JOLTS report: monthly increases, but significant downward revisions to 2024
August JOLTS report: nearly all employment measures now neutral
The JOLTS report for August showed a decline in all metrics m/m as well as a slowing trend overall.
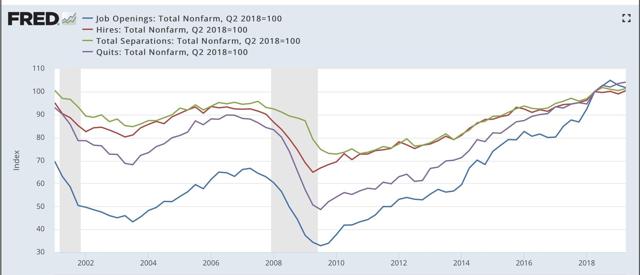
To review, because this series is only 20 years old, we only have one full business cycle to compare. During the 2000s expansion:
- Hires peaked first, from December 2004 through September 2005
- Quits peaked next, in September 2005
- Layoffs and Discharges peaked next, from October 2005 through September 2006
- Openings peaked last, in April 2007
as shown in the below graph (quarterly, normed to 100 as of May 2018):
Here is the close-up on the past five years (monthly):
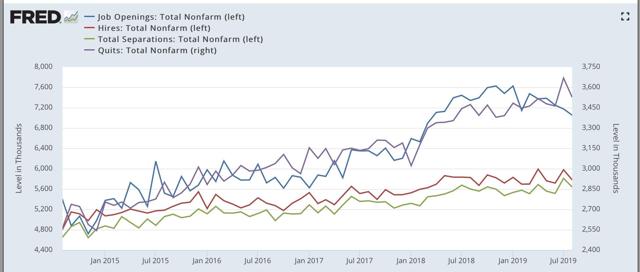
As you can see, in today’s report all four metrics declined. Job openings have completely rolled over, and both quits and total separations have essentially been stagnant for over a year. This is shown even better by displaying the YoY% changes in all four metrics:
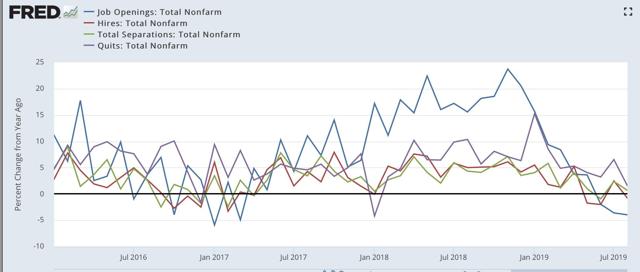
Only quits are in any significant sense above where they were a year ago. Hires and separations are flat. This is very similar to where we were at the end of the 2016 slowdown, but also to where we were in early 2007 before the Great Recession: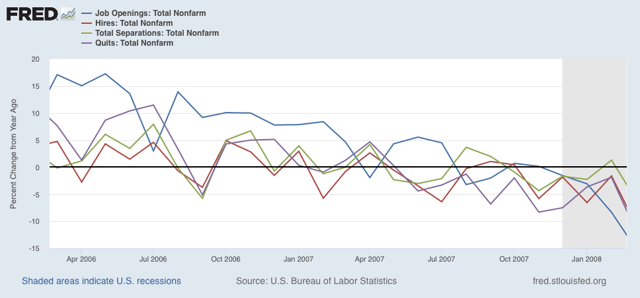
Next, here is the history of the “hiring leads firing” (actually, total separations) metric, first quarterly through Q2 of this year: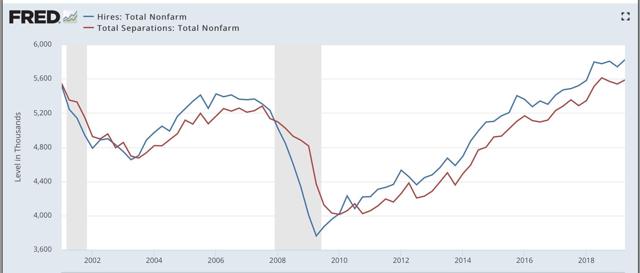
And now monthly for the past three years through August:
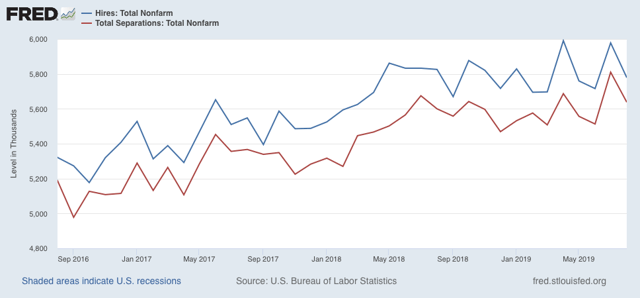
As is again apparent, both hires and fires have essentially gone sideways for over the last twelve months. It is possible this is just a pause, like 2016 — or it could be that both are at a turning point.
Finally, For completeness’ sake, below are total layoffs and discharges. Note that these turned up appreciably in the six months or so before the Great Recession. the silver lining today is that, just as with initial jobless claims, there is no sign of any weakness at this point:
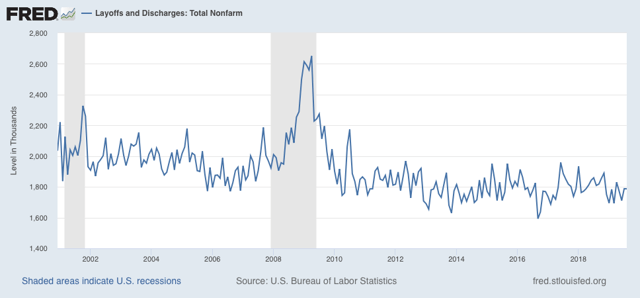
In summary, the main takeway is that deceleration in nearly all metrics has now reached neutral levels. We are hampered by the limited history of this report from reading too much more into it. But it is certainly *not* a “good” or “strong” report.
