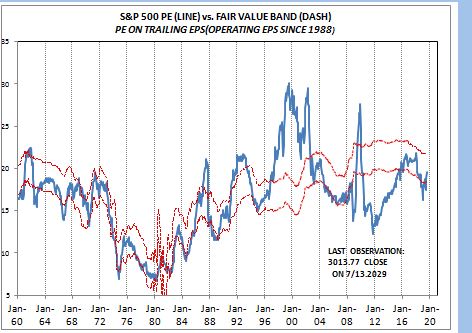
Friday evening the S&P 500 closed at 3013.77, up 20.2 % year to date. But much of that gain is just recovering from the drop in late 2019, as it is only up some 3.4% from September, 2019. This is the first time the S&P closed above 3000 and people are wondering if the market is overvalued. The S&P 500 PE is now at 19.6, almost exactly where my model implies it should be. As the chart shows it is right in the middle of my estimated fair value band just as it was when Trump was elected. But the PE was 21.3 in November, 2017 as compared to 19.6 now. Both the actual PE and the fair value band declined through 2017 and 2018 and the fair value band has stabilized so far this year. Interestingly, this means that S&P EPS has been rising faster than the market
Topics:
Spencer England considers the following as important: Featured Stories, Taxes/regulation, US/Global Economics
This could be interesting, too:
Ken Melvin writes A Developed Taste
Joel Eissenberg writes How Tesla makes money
Angry Bear writes True pricing: effects on competition
Angry Bear writes The paradox of economic competition
Friday evening the S&P 500 closed at 3013.77, up 20.2 % year to date. But much of that gain is just recovering from the drop in late 2019, as it is only up some 3.4% from September, 2019.
This is the first time the S&P closed above 3000 and people are wondering if the market is overvalued. The S&P 500 PE is now at 19.6, almost exactly where my model implies it should be. As the chart shows it is right in the middle of my estimated fair value band just as it was when Trump was elected. But the PE was 21.3 in November, 2017 as compared to 19.6 now. Both the actual PE and the fair value band declined through 2017 and 2018 and the fair value band has stabilized so far this year. Interestingly, this means that S&P EPS has been rising faster than the market since Trump was elected. So, aside from the tax cut, investors are not projecting that his economic policies will generate stronger earnings growth.
But my model PE is strictly a function of interest rates. It is an expression of what is the present value of a perpetual stream of earnings growth. You can see how the model said the market was very expensive in the 1990s when investors came to believe that we were in a new era of stronger growth with out a significant risk of recession. The early 2000s were just the opposite, when investors feared we were in a new era of permanent stagnation and very weak earnings growth. So the PE was very far below its fair value.
Currently, I suspect that that the uncertainty about Trump’s economic policies should have a significant dampening impact on investors perception of risk. But I do not have a good measure of that risk –maybe, one or two percentage points of PE or maybe even more. If this were the case, the actual PE would be near the top of the fair value band, implying that the market was expensive.
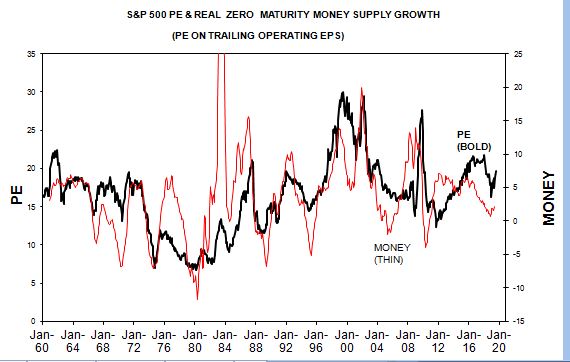
But I do have a very good leading-concurrent indicator of the market PE and zero maturity money supply growth –M1 plus money market and small time deposits.
As the chart shows real MZM growth bottomed late last year and has been strengthening all through 2019. Moreover, the three month growth rate has been rising faster than the annual growth rate all this year, strongly implying that the year-over-year growth will continue to signal a rising PE for some time.


