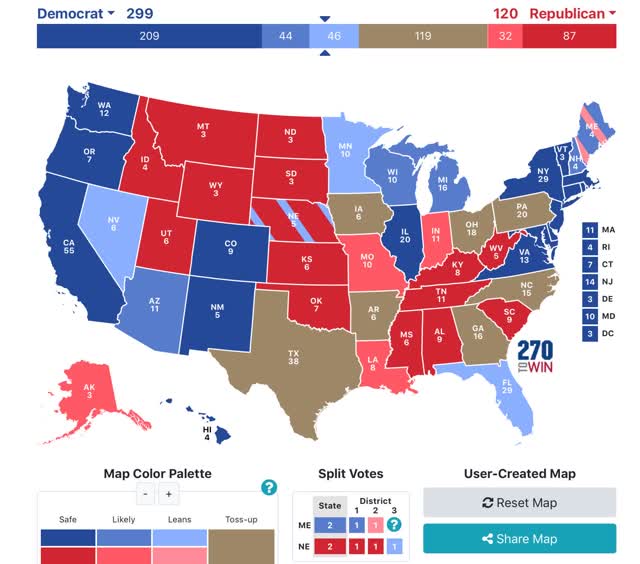
The 2020 Presidential election as forecast by State polling As we all know, in the US Presidential election national polls are of limited use, as the election is actually decided on a State by State basis. I’ve seen lots of projections of the Electoral College vote based on national polls, but what if we go just by State polls, and in particular State polls that have been reported in the last 30 days? That, dear reader, is what the following map looks like: I prepared this map after a slew of State polling was reported on Wednesday. Here’s how it works: – States where the race is closer than 3% are shown as toss-ups. – States where the range is between 3% to 5% are light colors. – States where the range is between 5% and 10% are medium colors. – States
Topics:
NewDealdemocrat considers the following as important: Featured Stories, politics, US/Global Economics
This could be interesting, too:
Robert Skidelsky writes Lord Skidelsky to ask His Majesty’s Government what is their policy with regard to the Ukraine war following the new policy of the government of the United States of America.
Joel Eissenberg writes No Invading Allies Act
Ken Melvin writes A Developed Taste
Bill Haskell writes The North American Automobile Industry Waits for Trump and the Gov. to Act
The 2020 Presidential election as forecast by State polling
As we all know, in the US Presidential election national polls are of limited use, as the election is actually decided on a State by State basis.
I’ve seen lots of projections of the Electoral College vote based on national polls, but what if we go just by State polls, and in particular State polls that have been reported in the last 30 days?
That, dear reader, is what the following map looks like:

I prepared this map after a slew of State polling was reported on Wednesday. Here’s how it works:
– States where the race is closer than 3% are shown as toss-ups.
– States where the range is between 3% to 5% are light colors.
– States where the range is between 5% and 10% are medium colors.
– States where the candidate is leading by 10% plus are dark colors.
The only change since Wednesday is that there was a Minnesota poll that gave Biden a 16% lead, enough to bring the average for that State over 10% in favor of Biden.
As of now, all Biden has to do is win the States in which he leads by 3% or more in the polling, and he wins the Electoral College, even without winning a single “toss-up” State as shown on the map.
The only surprising negative for Biden is that Pennsylvania remains a toss-up. Surprisingly, little polling has been done in that State, but while Biden has a slim lead on average, there are several polls dating from May that show a slight Trump lead.
I expect some of the Confederate States to return to the Trump fold. He always polls his worst when he appears both cruel and clueless. And that’s exactly what he has appeared between his actions on both COVID-19 and Black Lives Matter. His stands are unpopular, and his P.R. stunts (most notably the photo-op at the church) simultaneously have looked tin-eared and execrable.
