Coronavirus dashboard for June 12: the costs of recklessly reopening begin to come due – by New Deal democrat It is pretty clear now that in general those States (but not all) which left lockdowns the earliest and with the most lax continuing restrictions are suffering renewed outbreaks of the coronavirus, *possibly* in several cases verging on exponential spread. For the US in total, the 7 day average of deaths has continued to decline, now at 803 per day vs. 2,201 on the April 18 peak: Among the 40 States that consistently report hospitalizations, the number has still also declined: But new cases averaged over the past 7 days have started to rise again, now at 21,527 vs. the low of 20,658 on May 28: The increase cannot be put down to
Topics:
NewDealdemocrat considers the following as important: US/Global Economics
This could be interesting, too:
Joel Eissenberg writes How Tesla makes money
Angry Bear writes True pricing: effects on competition
Angry Bear writes The paradox of economic competition
Angry Bear writes USMAC Exempts Certain Items Coming out of Mexico and Canada
Coronavirus dashboard for June 12: the costs of recklessly reopening begin to come due
– by New Deal democrat
It is pretty clear now that in general those States (but not all) which left lockdowns the earliest and with the most lax continuing restrictions are suffering renewed outbreaks of the coronavirus, *possibly* in several cases verging on exponential spread.
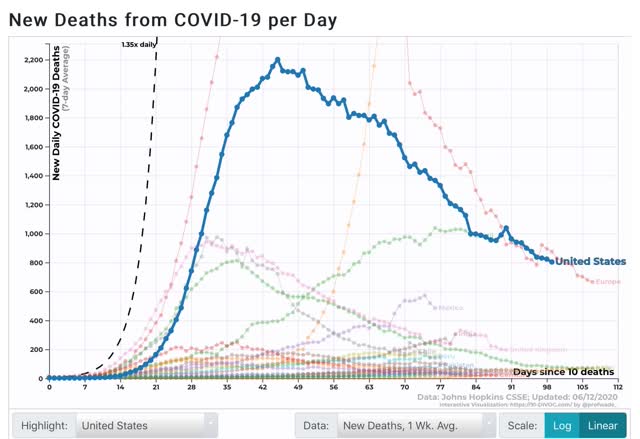
For the US in total, the 7 day average of deaths has continued to decline, now at 803 per day vs. 2,201 on the April 18 peak:
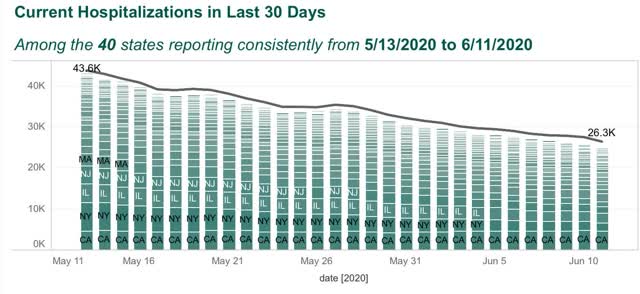
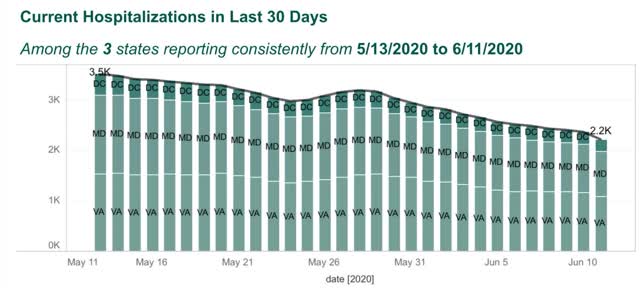
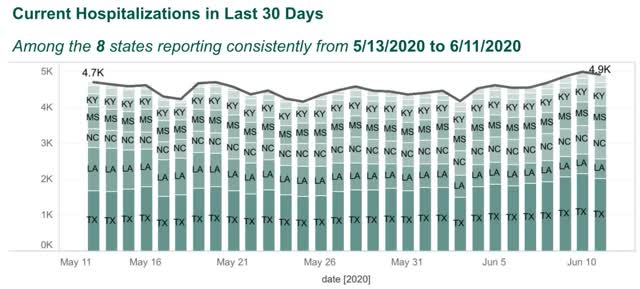
Among the 40 States that consistently report hospitalizations, the number has still also declined:
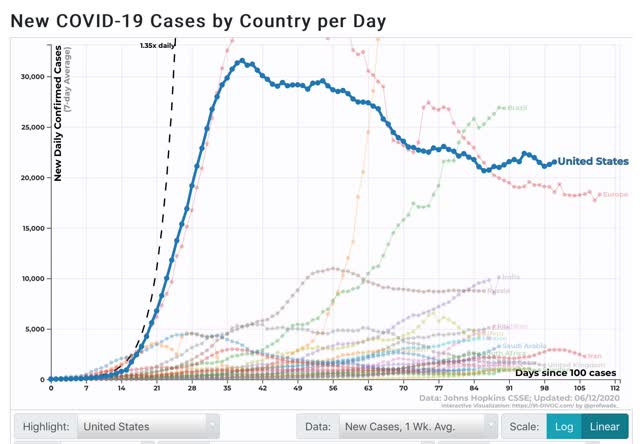
But new cases averaged over the past 7 days have started to rise again, now at 21,527 vs. the low of 20,658 on May 28:
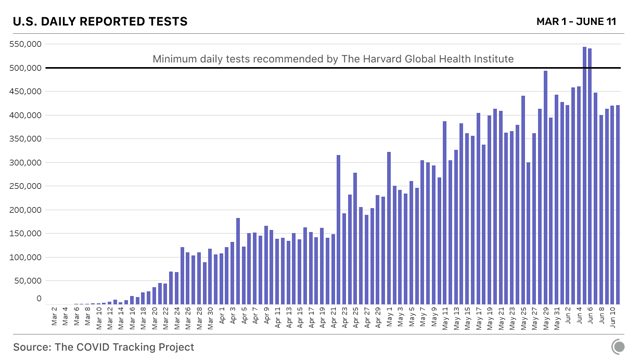
The increase cannot be put down to increased testing, as the 7 day average has leveled off in the past week:
Here is the breakdown of new infections by region:
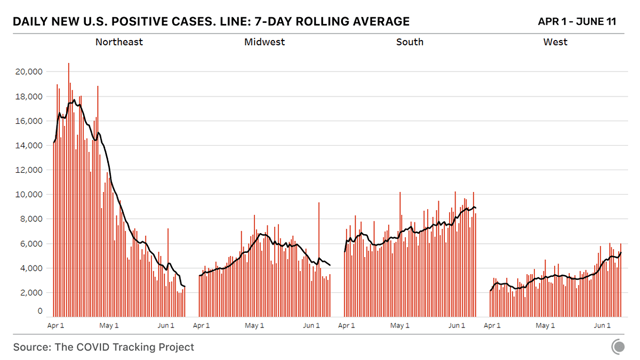
Note, however, that the above graphs are not per capita. The below chart of the last 7 days, however, is:
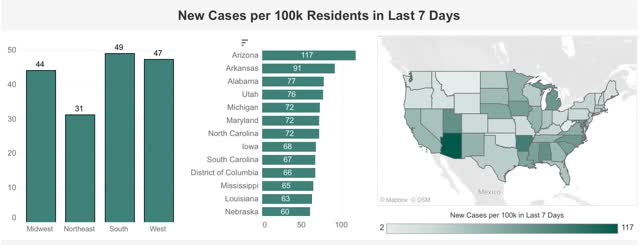
It is crystal clear that the new hot spots are in those States which recklessly relaxed restrictions.
The Washington DC area, including MD and VA, has been a hot spot, but that is abating somewhat:
But the other States of the Confederacy (plus OK and KY), are clearly seeing an increase in cases:
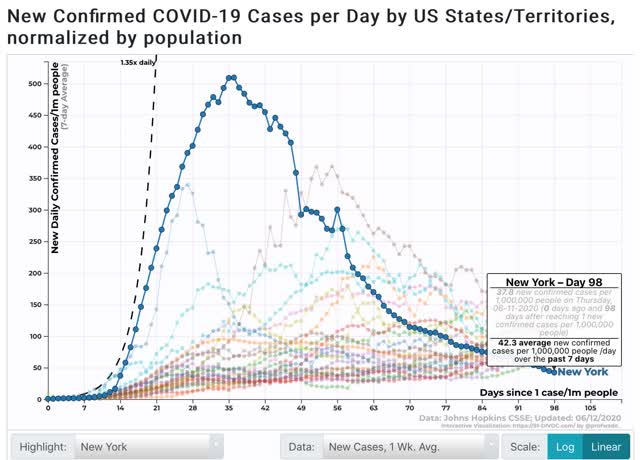
NY, which had the worst outbreak by far, is down to 42 new daily infections per million:
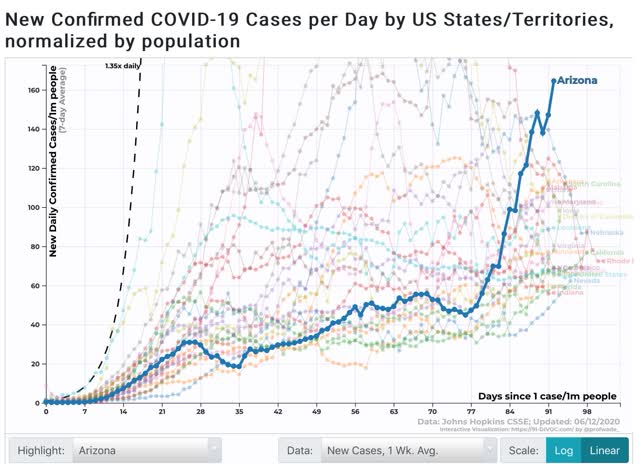
I call the above to your attention, because among States that are seeing new outbreaks, here in particular are Arizona, as of yesterday at 167 per million:
And here is Florida:

And Texas:
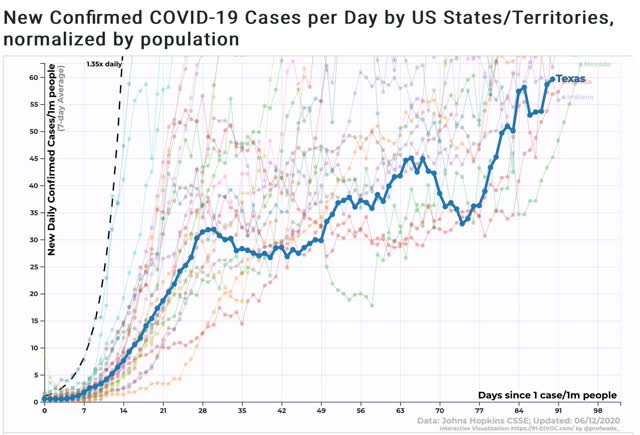
All three have new infection rates of over 50 per million population, above NY’s current number.
There is no certainty that the sudden increases in these three (and other) States will continue, but in the aggregate there is no doubt that the virus is spreading again. It remains to be seen if outbreaks approaching the prevalence formerly in the NYC area will lead to renewed lockdowns in any of the affected States.