This is what exponential growth looks like I’ve placed an added emphasis on high frequency indicators, as they will be the first to show the impact of coronavirus on the economy. This morning chain store sales for last week were reported. They were: – Redbook +6.0% YoY – Retail Economist unchanged w/w, +0.9% YoY Needless to say, there was no impact at all on the Redbook number. While the Retail Economist number was definitely weak, there have been other, similar weak weeks earlier this year, so that number is equivocal. I suspect that this situation will change in no more than two weeks. Meanwhile, here is a graph of the number of coronavirus cases in a number of countries including the US, compared with Italy, the epicenter of the outbreak in Europe
Topics:
NewDealdemocrat considers the following as important: Hot Topics, Journalism, politics, US/Global Economics
This could be interesting, too:
Robert Skidelsky writes Lord Skidelsky to ask His Majesty’s Government what is their policy with regard to the Ukraine war following the new policy of the government of the United States of America.
NewDealdemocrat writes JOLTS revisions from Yesterday’s Report
Joel Eissenberg writes No Invading Allies Act
Ken Melvin writes A Developed Taste
This is what exponential growth looks like
I’ve placed an added emphasis on high frequency indicators, as they will be the first to show the impact of coronavirus on the economy.
This morning chain store sales for last week were reported. They were:
– Redbook +6.0% YoY
– Retail Economist unchanged w/w, +0.9% YoY
Needless to say, there was no impact at all on the Redbook number. While the Retail Economist number was definitely weak, there have been other, similar weak weeks earlier this year, so that number is equivocal. I suspect that this situation will change in no more than two weeks.
Meanwhile, here is a graph of the number of coronavirus cases in a number of countries including the US, compared with Italy, the epicenter of the outbreak in Europe (via Mark Handley, a Professor of Networked Systems in the UK):
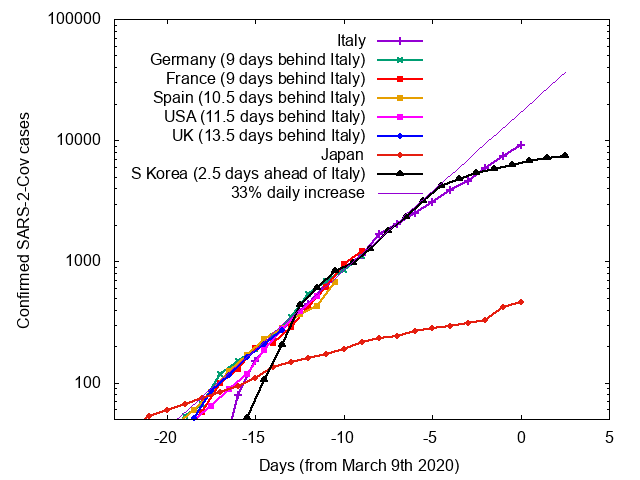
Notice that the graph is in log scale, where exponential growth is shown as a straight line. South Korea and Japan, both of which have taken very aggressive testing and quarantine measures, show a slow spread, and in South Korea the number of *new* cases has actually declined in the past few days, leading to the total number shown above to level out. The US, by contrast, is on track to have the same number of cases Italy has now in about a week and a half.
This is what exponential growth looks like. The spread of the disease looks manageable, until all of a sudden it very much is not. This is why, even if the disease abates with warmer weather, exactly *how* warm the weather has to be makes an important idfference between a contained and a calamitous outbreak<.