Coronavirus dashboard for June 7: a Tale of Two Pandemics: the Vaccinated States vs. the Idiotic States The drive towards “herd immunity” via vaccination has slowed to a crawl. The slowing is almost entirely driven by Trump-voting States in the South and West. Those Idiotic States are continuing to suffer from an ongoing pandemic, while in the Biden-voting States of the Northeast, Midwest, and California, the pandemic has all but ended.Here are the details. Daily vaccinations have declined precipitously in the past 7 weeks, and are now only about 1 million per day: If the US were to stay at 1 million per day, it would take the rest of the year to get everyone vaccinated. And unfortunately, there is no reason to believe that the rate
Topics:
NewDealdemocrat considers the following as important: coronavirus and politics, coronavirus dashboard, Featured Stories, Healthcare, politics
This could be interesting, too:
Robert Skidelsky writes Lord Skidelsky to ask His Majesty’s Government what is their policy with regard to the Ukraine war following the new policy of the government of the United States of America.
Joel Eissenberg writes No Invading Allies Act
Ken Melvin writes A Developed Taste
Bill Haskell writes The North American Automobile Industry Waits for Trump and the Gov. to Act
Coronavirus dashboard for June 7: a Tale of Two Pandemics: the Vaccinated States vs. the Idiotic States
The drive towards “herd immunity” via vaccination has slowed to a crawl. The slowing is almost entirely driven by Trump-voting States in the South and West. Those Idiotic States are continuing to suffer from an ongoing pandemic, while in the Biden-voting States of the Northeast, Midwest, and California, the pandemic has all but ended.
Here are the details.
Daily vaccinations have declined precipitously in the past 7 weeks, and are now only about 1 million per day:
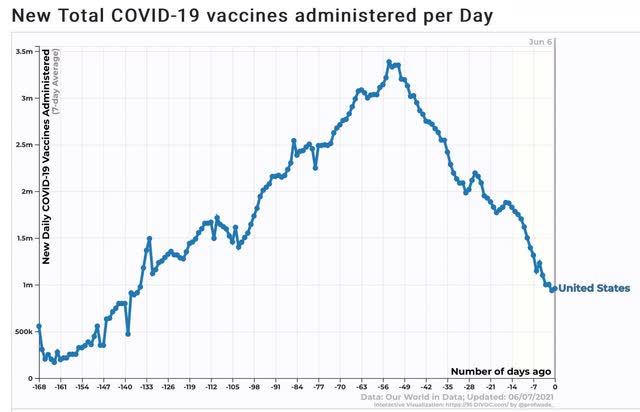
If the US were to stay at 1 million per day, it would take the rest of the year to get everyone vaccinated. And unfortunately, there is no reason to believe that the rate of new vaccinations won’t continue to decline.
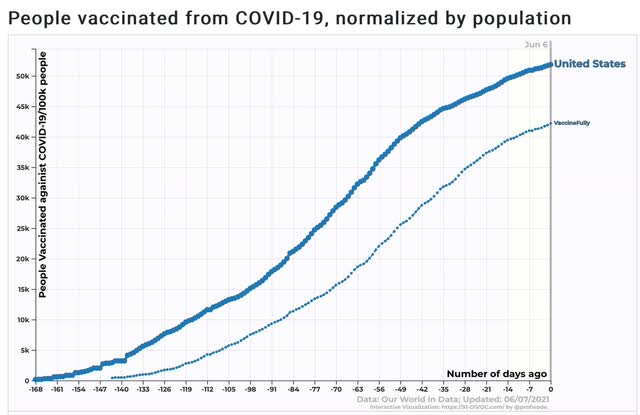
As a result, as shown in the graph below, there is every reason to believe that the US will tip out at roughly 60% of the population having received at least one dose, and only 50% fully vaccinated (note this includes all children including those under 12 for whom the vaccines have not been approved). (For the record, I still think we will achieve 70%+ of all adults having immunity between vaccinations plus those previously infected with antibodies).
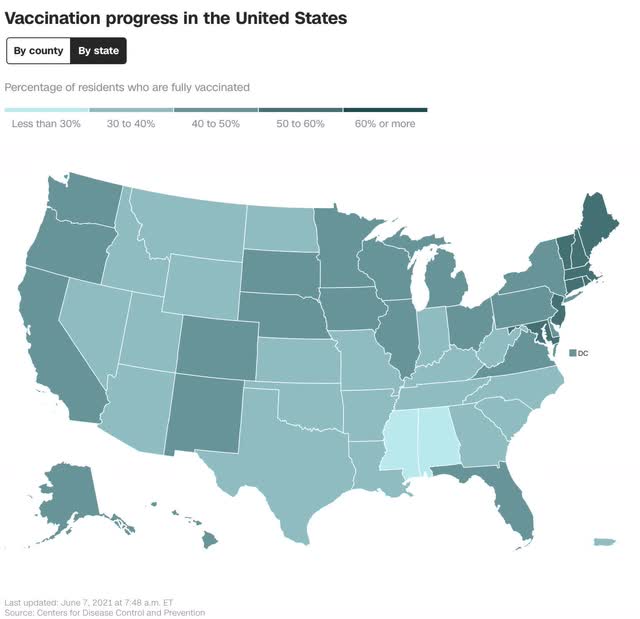
The distribution of the population who have been vaccinated vs. unvaccinated is hardly random. As shown in the below map, the South and interior West almost uniformly have lower vaccination rates than the Pacific Coast, Midwest, and Northeast:
And this completely non-random pattern is very apparent when we break down new COVID cases by region.
The best region is the Northeast:
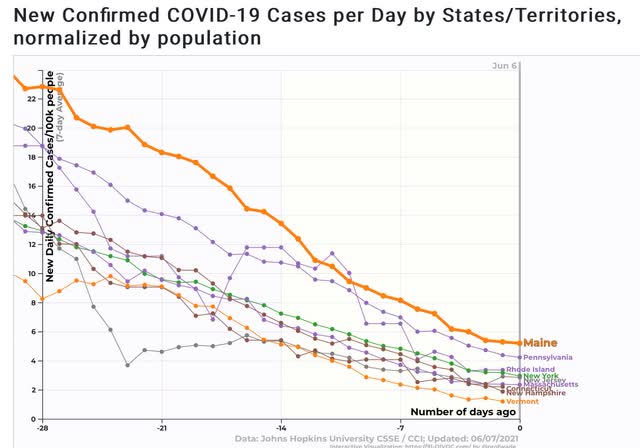
All States except for Maine and Pennsylvania are below an average of 40 cases per 100,000 per day, and the worst State – Maine – is at 5.2. Half of the States are close to or under 2 per 100,000 per day, which is a pandemic that is well under control.
The next best region is the Midwest, plus Maine for comparison:
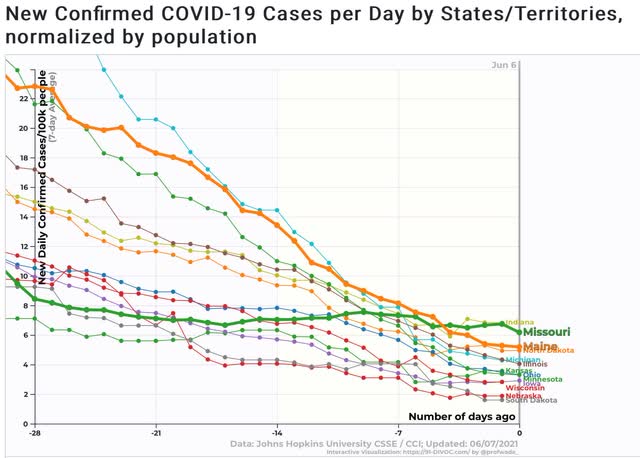
Nebraska and South Dakota are also under 2 cases per 100,000 per day. I suspect herd immunity via the large number of already infected people comes into play in those States. Only Missouri and Indiana have a higher rate of cases than Maine. And all of the States, except for Missouri (also highlighted) continue on a downward trajectory.
The next best region is the South, plus Maine and Missouri for comparison:
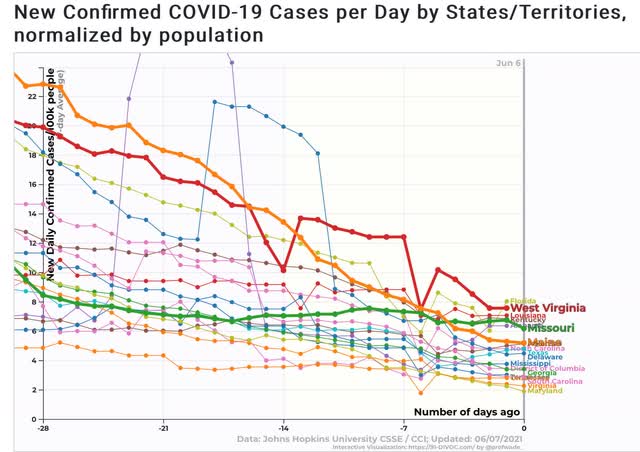
Maryland and Virginia are close to or under 2 per 100,000 per day. About half of the remaining States in the region show a *slowly* declining trajectory, but have fewer cases per capita than Maine. The other half, including the large State of Florida, show a pandemic that is ongoing. I have also highlighted West Virginia, which aside from the last observation, is the worst of the lot.
Finally, we come to the West, which is the worst-performing region, plus Maine, Missouri, and West Virginia for comparison:
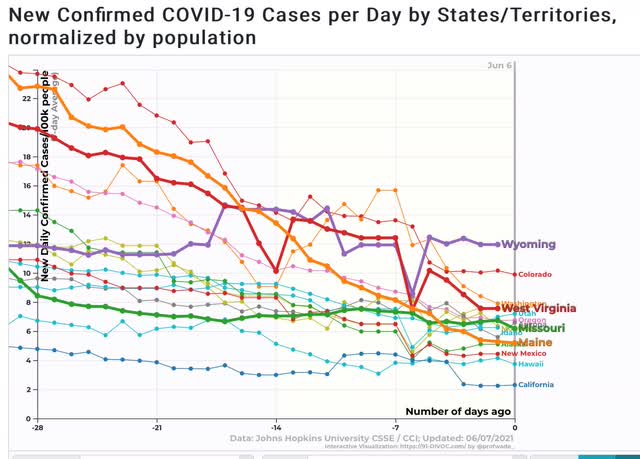
California is very close to 2 per 100,000 per day. Several other States are lower than Maine. But most are worse than Missouri, and 3 – surprisingly including Colorado (which is nevertheless clearly in a declining trend) and Washington State (which may finally be declining) – are worse than West Virginia. Wyoming is the worst of all States, with 11.9 cases per 100,000 per day, a pandemic that continues to rage, and with no sign of any decrease at all.
Finally, here is a graph of the 10 worst States together, plus Missouri which is slightly below that level:
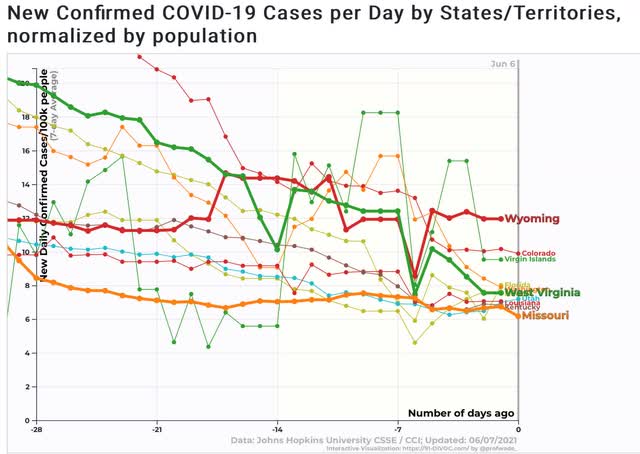
Just to emphasize the point, here are the 10 lowest States by the rate of those fully vaccinated:
MS 28%
AL 29%
WY 32%
LA 32%
AR 32%
TN 32%
ID 33%
UT 33%
GA 33%
OK 34%
All 10 of these States are in the South and West. Four of them are among the 10 worst States for new infections. By contrast, all of the 6 New England States are above 50% for those fully vaccinated, and of those only Maine is at a problematic level, although clearly declining.
“Those who cannot see must feel.” Those regions with populations who refuse to get vaccinated will continue to see the pandemic spread through the unvaccinated until they reach “herd immunity” the hard way. Those regions whose populations have embraced vaccinations are likely to achieve “herd immunity” and the de facto end of the pandemic within the next 45 days.
