August CPI: sharp gains in housing and new cars offset declines in used cars and gas – by New Deal democrat Following up on yesterday’s post, let’s cut to the chase: Total CPI +0.1% Energy -5.0% Used vehicles -0.1% New vehicles +0.8% Owners’ equivalent rent +0.7% (biggest monthly gain since 1990) YoY inflation declined to +8.3% from its recent +9.0% peak: The 0.7% increase in owner’s equivalent rent was the biggest monthly gain since 1990. YoY OER increased to 6.3%, the highest since the series started in 1984, with the exception of two months in 1986. Here it is YoY in comparison with the FHFA house price index (/2 for scale) since the latter series started in 1993: OER lags house prices by 12-18 months. House price
Topics:
NewDealdemocrat considers the following as important: New Deal Democrat, US/Global Economics
This could be interesting, too:
Joel Eissenberg writes How Tesla makes money
Angry Bear writes True pricing: effects on competition
Angry Bear writes The paradox of economic competition
Angry Bear writes USMAC Exempts Certain Items Coming out of Mexico and Canada
August CPI: sharp gains in housing and new cars offset declines in used cars and gas
– by New Deal democrat
Following up on yesterday’s post, let’s cut to the chase:
Total CPI +0.1%
Energy -5.0%
Used vehicles -0.1%
New vehicles +0.8%
Owners’ equivalent rent +0.7% (biggest monthly gain since 1990)
YoY inflation declined to +8.3% from its recent +9.0% peak:
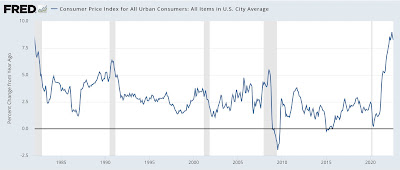
The 0.7% increase in owner’s equivalent rent was the biggest monthly gain since 1990. YoY OER increased to 6.3%, the highest since the series started in 1984, with the exception of two months in 1986. Here it is YoY in comparison with the FHFA house price index (/2 for scale) since the latter series started in 1993:
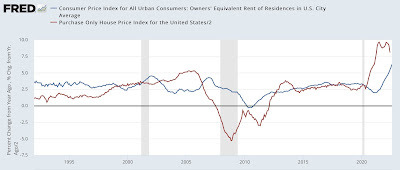
OER lags house prices by 12-18 months. House price appreciation peaked in June 2021, so we should be approaching the peak in OER as well, but if it rises proportionately to house prices as it did in the 2000s housing bubble, it could continue to rise to 7.5% or 8% before declining. And since OER plus rents (which also rose 0.7% for the month) is 40% of core inflation, it would take an absolute decline in everything else in the core measure just to get it down under a 0.4% increase per month (vs. 0.6% in August).
And new vehicle prices didn’t help at all. While their YoY increases are down from their peak, they are still up 10.4% YoY. Used vehicle prices are up 7.8% YoY, and have stopped decelerating in the past several months:
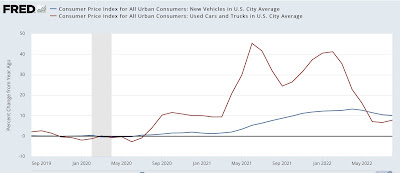
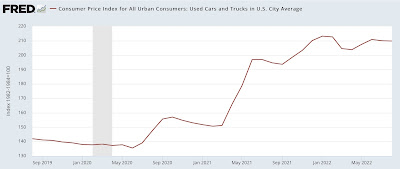
The one silver lining here is that used vehicle prices have not risen at all since last December (although that’s at a level that is 50% higher than when the pandemic hit):
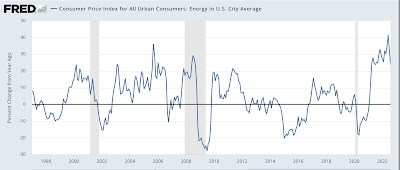
As anticipated, energy prices declined even more in August than in July. YoY energy is up 23.9% (but well below its peak earlier this year):
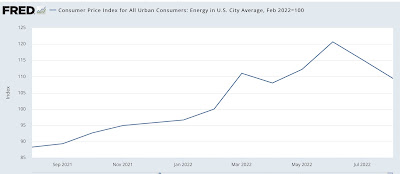
Energy prices are still up 9.4% since February, just before the Ukraine invasion:
In essence, inflation at this point is primarily a function of the fictitious and lagging measure of housing that is used by the Census Bureau (keeping in mind that the house price indexes are still up over 15% YoY, although they may be shown to have peaked during the summer), plus the shortage of computer chips for manufacturing vehicles.
Let’s finally update real wages. These rose 0.2% in August. But that has done little to offset their decline since late 2021. YoY they have declined -2.2%:
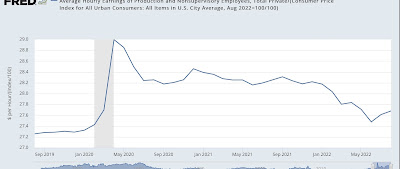
To emphasize again, this loss is mainly about housing, plus supply issues for new cars, and the now-resolving Ukraine invasion spike in gas prices.
I will voice an opinion that I believe is well out of the mainstream at this point: so long as mortgage rates stay at 5% or higher, there is no reason for the Fed to raise rates further. It is chasing a horse that is 3 counties away from the barn, and has stopped running.
