RJS, Focus on Fracking, SPR at a 19 year low: total oil + products supplies, including SPR, at a 7 3/4 year low, distillate supplies at 26 month low Overall oil inventories finally rose after a million+ barrel per day jump in oil imports; commercial crude supplies saw their biggest increase since October 10th after pulling ~350k barrels per day out of the SPR, i.e. switching the deck chairs on the Titanic . . . other trends remained in place… The Latest US Oil Supply and Disposition Data from the EIA US oil data from the US Energy Information Administration for the week ending February 18th indicated that after a big jump in our oil imports, we had oil left to add to our stored commercial crude supplies for the fourth time in 13 weeks
Topics:
Angry Bear considers the following as important: EIA, Focus on Fracking, Hot Topics, Oil, RJS, US/Global Economics
This could be interesting, too:
NewDealdemocrat writes JOLTS revisions from Yesterday’s Report
Joel Eissenberg writes No Invading Allies Act
Joel Eissenberg writes How Tesla makes money
NewDealdemocrat writes January JOLTS report: monthly increases, but significant downward revisions to 2024
RJS, Focus on Fracking,
SPR at a 19 year low: total oil + products supplies, including SPR, at a 7 3/4 year low, distillate supplies at 26 month low
Overall oil inventories finally rose after a million+ barrel per day jump in oil imports; commercial crude supplies saw their biggest increase since October 10th after pulling ~350k barrels per day out of the SPR, i.e. switching the deck chairs on the Titanic . . . other trends remained in place…
The Latest US Oil Supply and Disposition Data from the EIA
US oil data from the US Energy Information Administration for the week ending February 18th indicated that after a big jump in our oil imports, we had oil left to add to our stored commercial crude supplies for the fourth time in 13 weeks and for the 14th time in the past thirty-nine weeks…our imports of crude oil rose by an average of 1,038,000 barrels per day to an average of 6,828,000 barrels per day, after falling by an average of 599,000 barrels per day during the prior week, while our exports of crude oil rose by an average of 415,000 barrels per day to an average of 2,686,000 barrels per day during the week, which together meant that our effective trade in oil worked out to a net import average of 4,142,000 barrels of per day during the week ending February 18th, 623,000 more barrels per day than the net of our imports minus our exports during the prior week…over the same period, production of crude oil from US wells was reportedly unchanged at 11,600,000 barrels per day, and hence our daily supply of oil from the net of our international trade in oil and from domestic well production appears to have totaled an average of 15,742,000 barrels per day during the cited reporting week…
Meanwhile, US oil refineries reported they were processing an average of 15,246,000 barrels of crude per day during the week ending February 18th, an average of 344,000 more barrels per day than the amount of oil than our refineries processed during the prior week, while over the same period the EIA’s surveys indicated that a net of 296,000 barrels of oil per day were being added to the supplies of oil stored in the US….so based on that reported & estimated data, this week’s crude oil figures from the EIA appear to indicate that our total working supply of oil from net imports and from oilfield production was 200,000 barrels per day more than what was added to storage plus what our oil refineries reported they used during the week…to account for that disparity between the apparent supply of oil and the apparent disposition of it, the EIA just inserted a (-200,000) barrel per day figure onto line 13 of the weekly U.S. Petroleum Balance Sheet to make the reported data for the daily supply of oil and the consumption of it balance out, essentially a balance sheet fudge factor that they label in their footnotes as “unaccounted for crude oil”, thus suggesting there must have been a error or omission of that magnitude in this week’s oil supply & demand figures that we have just transcribed….however, since most everyone treats these weekly EIA reports as gospel and since these figures often drive oil pricing, and hence decisions to drill or complete oil wells, we’ll continue to report this data just as it’s published, and just as it’s watched & believed to be reasonably accurate by most everyone in the industry…(for more on how this weekly oil data is gathered, and the possible reasons for that “unaccounted for” oil, see this EIA explainer)….
This week’s 296,000 barrel per day increase in our overall crude oil inventories came as 645,000 barrels per day were being added to our commercially available stocks of crude oil, while 349,000 barrels per day of oil were being pulled out of our Strategic Petroleum Reserve, part of the Biden’ administration plan to release 50 million barrels from the SPR to incentivize US gasoline consumption….including other withdrawals from the Strategic Petroleum Reserve under similar recent programs, a total of 73,765,000 barrels have been removed from the Strategic Petroleum Reserve over the past 19 months, and as a result the 582,384,000 barrels of oil now left in our Strategic Petroleum Reserve is now the lowest since September 6th, 2002, or at yet another new 19 year low, as repeated tapping of our emergency supplies for non-emergencies has already drained those supplies considerably over the past dozen years…based on an estimated prepandemic consumption level of around 18 million barrels per day, the US would have roughly 30 1/2 days of oil supply left in the Strategic Petroleum Reserve when the initial Biden program is complete, not counting what else might yet be withdrawn in the wake of the Ukraine situation…
Further details from the weekly Petroleum Status Report (pdf) indicate that the 4 week average of our oil imports rose to an average of 6,523,000 barrels per day last week, which was 14.1% more than the 5,715,000 barrel per day average that we were importing over the same four-week period last year….this week’s crude oil production was reported to be unchanged at 11,600,000 barrels per day as the EIA’s rounded estimate of the output from wells in the lower 48 states was unchanged at 11,100,000 barrels per day, while Alaska’s oil production was 3,000 barrels per day lower at 458,000 barrels per day but had no impact on the rounded national production total…US crude oil production had reached a pre-pandemic high of 13,100,000 barrels per day during the week ending March 13th 2020, so this week’s reported oil production figure was 11.5% below that of our pre-pandemic production peak, but 37.6% above the interim low of 8,428,000 barrels per day that US oil production had fallen to during the last week of June of 2016…
US oil refineries were operating at 87.4% of their capacity while using those 15,246,000 barrels of crude per day during the week ending February 18th, up from a utilization rate of 85.3% the prior week, but still lower than the historical utilization rate for mid February refinery operations…the 15,246,000 barrels per day of oil that were refined this week were 24.6% more barrels than the 12,230,000 barrels of crude that were being processed daily during the winter storm Uri impacted week ending February 19th of 2021, but 4.8% less than the 16,210,000 barrels of crude that were being processed daily during the week ending February 21st, 2020, when US refineries were operating at what was then also a lower than normal 87.9% of capacity…
With the big increase in oil being refined this week, gasoline output from our refineries was also much higher, increasing by 440,000 barrels per day to 9,270,000 barrels per day during the week ending February 18th, after our gasoline output had decreased by 560,000 barrels per day over the prior week.…this week’s gasoline production was 19.8% more than the 7,736,000 barrels of gasoline that were being produced daily over the same week of last year, but 5.4% less than the gasoline production of 9,797,000 barrels per day during the week ending February 21st, 2020….at the same time, our refineries’ production of distillate fuels (diesel fuel and heat oil) increased by 238,000 barrels per day to 4,693,000 barrels per day, after our distillates output had decreased by 244,000 barrels per day over the prior week…with that increase, our distillates output was 23.0% more than the 3,621,000 barrels of distillates that were being produced daily during the week ending February 19th of 2021, but 8.1% less than the 4,846,000 barrels of distillates that were being produced daily during the week ending February 21st, 2020…
Even with the big decrease in our gasoline production, our supplies of gasoline in storage at the end of the week fell for the fifth time in the past 13 weeks, decreasing by 582,000 barrels to 246,479,000 barrels during the week ending February 18th,after our gasoline inventories had decreased by 1,332,000 barrels over the prior week….our gasoline supplies decreased again this week because the amount of gasoline supplied to US users increased by 83,000 barrels per day to 8,657,000 barrels per day, and because our imports of gasoline fell by 139,000 barrels per day to 416,000 barrels per day, and because our exports of gasoline rose by 246,000 barrels per day to 685,000 barrels per day…after this week’s decrease, our gasoline supplies were 4.1% lower than last February 19th’s gasoline inventories of 257,096,000 barrels, and about 3% below the five year average of our gasoline supplies for this time of the year…

Meanwhile, even with this week’s sizable increase in our distillates production, our supplies of distillate fuels decreased for the eighteenth time in twenty-five weeks, falling by 584,000 barrels to a twenty six month low of 119,678,000 barrels during the week ending February 11th, after our distillates supplies had decreased by 1,552,000 barrels during the prior week….our distillates supplies fell again this week even though the amount of distillates supplied to US markets, an indicator of our domestic demand, fell by 82,000 barrels per day to 4,233,000 barrels per day, because our exports of distillatesrose by 166,000 barrels per day to 960,000 barrels per day while our imports of distillates fell by 21,000 barrels per day to 416,000 barrels per day….after thirty-two inventory decreases over the past forty-six weeks, our distillate supplies at the end of the week were 21.6% below the 152,715,000 barrels of distillates that we had in storage on February 19th of 2021, and about 19% below the five year average of distillates inventories for this time of the year…
Meanwhile, after the jump in our oil imports, our commercial supplies of crude oil in storage rose for the 11th time in 29 weeks and for the 19th time in the past year, increasing by 4,514,000 barrels over the week, from 411,508,000 barrels on February 11th to 416,022,000 barrels on February 18th, the biggest jump in commercial crude since October 10th, after our commercial crude supplies had increased by 1,121,000 barrels over the prior week…with this week’s increase, our commercial crude oil inventories increased to about 9% below the most recent five-year average of crude oil supplies for this time of year, and rose to almost 30% above the average of our crude oil stocks as of third weekend of February over the 5 years at the beginning of the past decade, with the disparity between those comparisons arising because it wasn’t until early 2015 that our oil inventories first topped 400 million barrels….since our crude oil inventories had jumped to record highs during the Covid lockdowns of spring 2020 and remained elevated for most of a year after that, our commercial crude oil supplies as of this February 18th were still 10.2% less than the 463,042,000 barrels of oil we had in commercial storage on February 19th of 2021, and also 6.1% less than the 443,335,000 barrels of oil that we had in storage on February 21st of 2020, and also 6.6% less than the 445,865,000 barrels of oil we had in commercial storage on February 22nd of 2019…
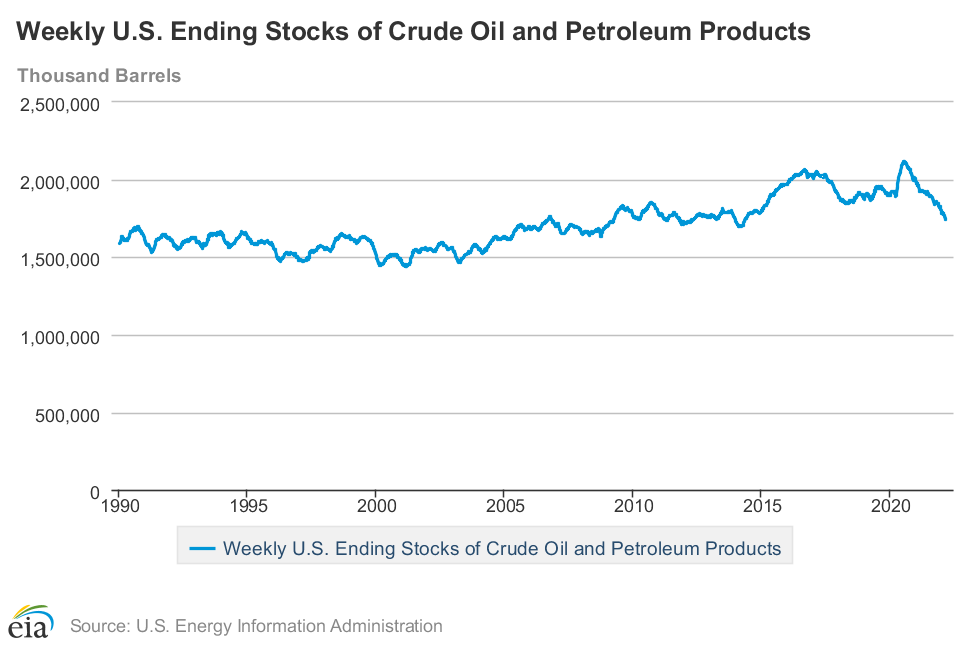
Finally, with our inventory of crude oil and our supplies of all products made from oil all near multi year lows, we are continuing to track the total of all U.S. Stocks of Crude Oil and Petroleum Products, including those in the SPR….the EIA’s data shows that the total of our oil and oil product inventories, including those in the Strategic Petroleum Reserve and those held by the oil industry, and thus including everything from gasoline and jet fuel to propane/propylene and residual fuel oil, fell by 4,273,000 barrels this week, from 1,745,787,000 barrels on February 11th to 1,741,514,000 barrels on February 18th…that left our total supplies of oil & its products now at the lowest since April 25th, 2014, or at a new seven and a half year low, despite this week’s big increase in commercial crude inventories.;..