RJS, MarketWatch 666, including estimates on the hit to GDP . . . the December deficit was revised up to what would have been a record high at the same time. US Trade Deficit Rose 9.4% to a Record High in January After December Deficit Revised Higher Our trade deficit rose 9.4% in January, as the value of our exports decreased while the value of our imports increased . . . the Commerce Dept report on our international trade in goods and services for January indicated that our seasonally adjusted goods and services trade deficit rose by a rounded .7 billion to a rounded .7 billion in January, from a December deficit that was revised up from .7 billion to .0 billion, while all prior monthly trade deficit figures for 2021 were revised as
Topics:
Angry Bear considers the following as important: GDP, Hot Topics, MarketWatch 666, politics, RJS, trade deficits, US/Global Economics
This could be interesting, too:
Robert Skidelsky writes Lord Skidelsky to ask His Majesty’s Government what is their policy with regard to the Ukraine war following the new policy of the government of the United States of America.
NewDealdemocrat writes JOLTS revisions from Yesterday’s Report
Joel Eissenberg writes No Invading Allies Act
Ken Melvin writes A Developed Taste
RJS, MarketWatch 666, including estimates on the hit to GDP . . . the December deficit was revised up to what would have been a record high at the same time.
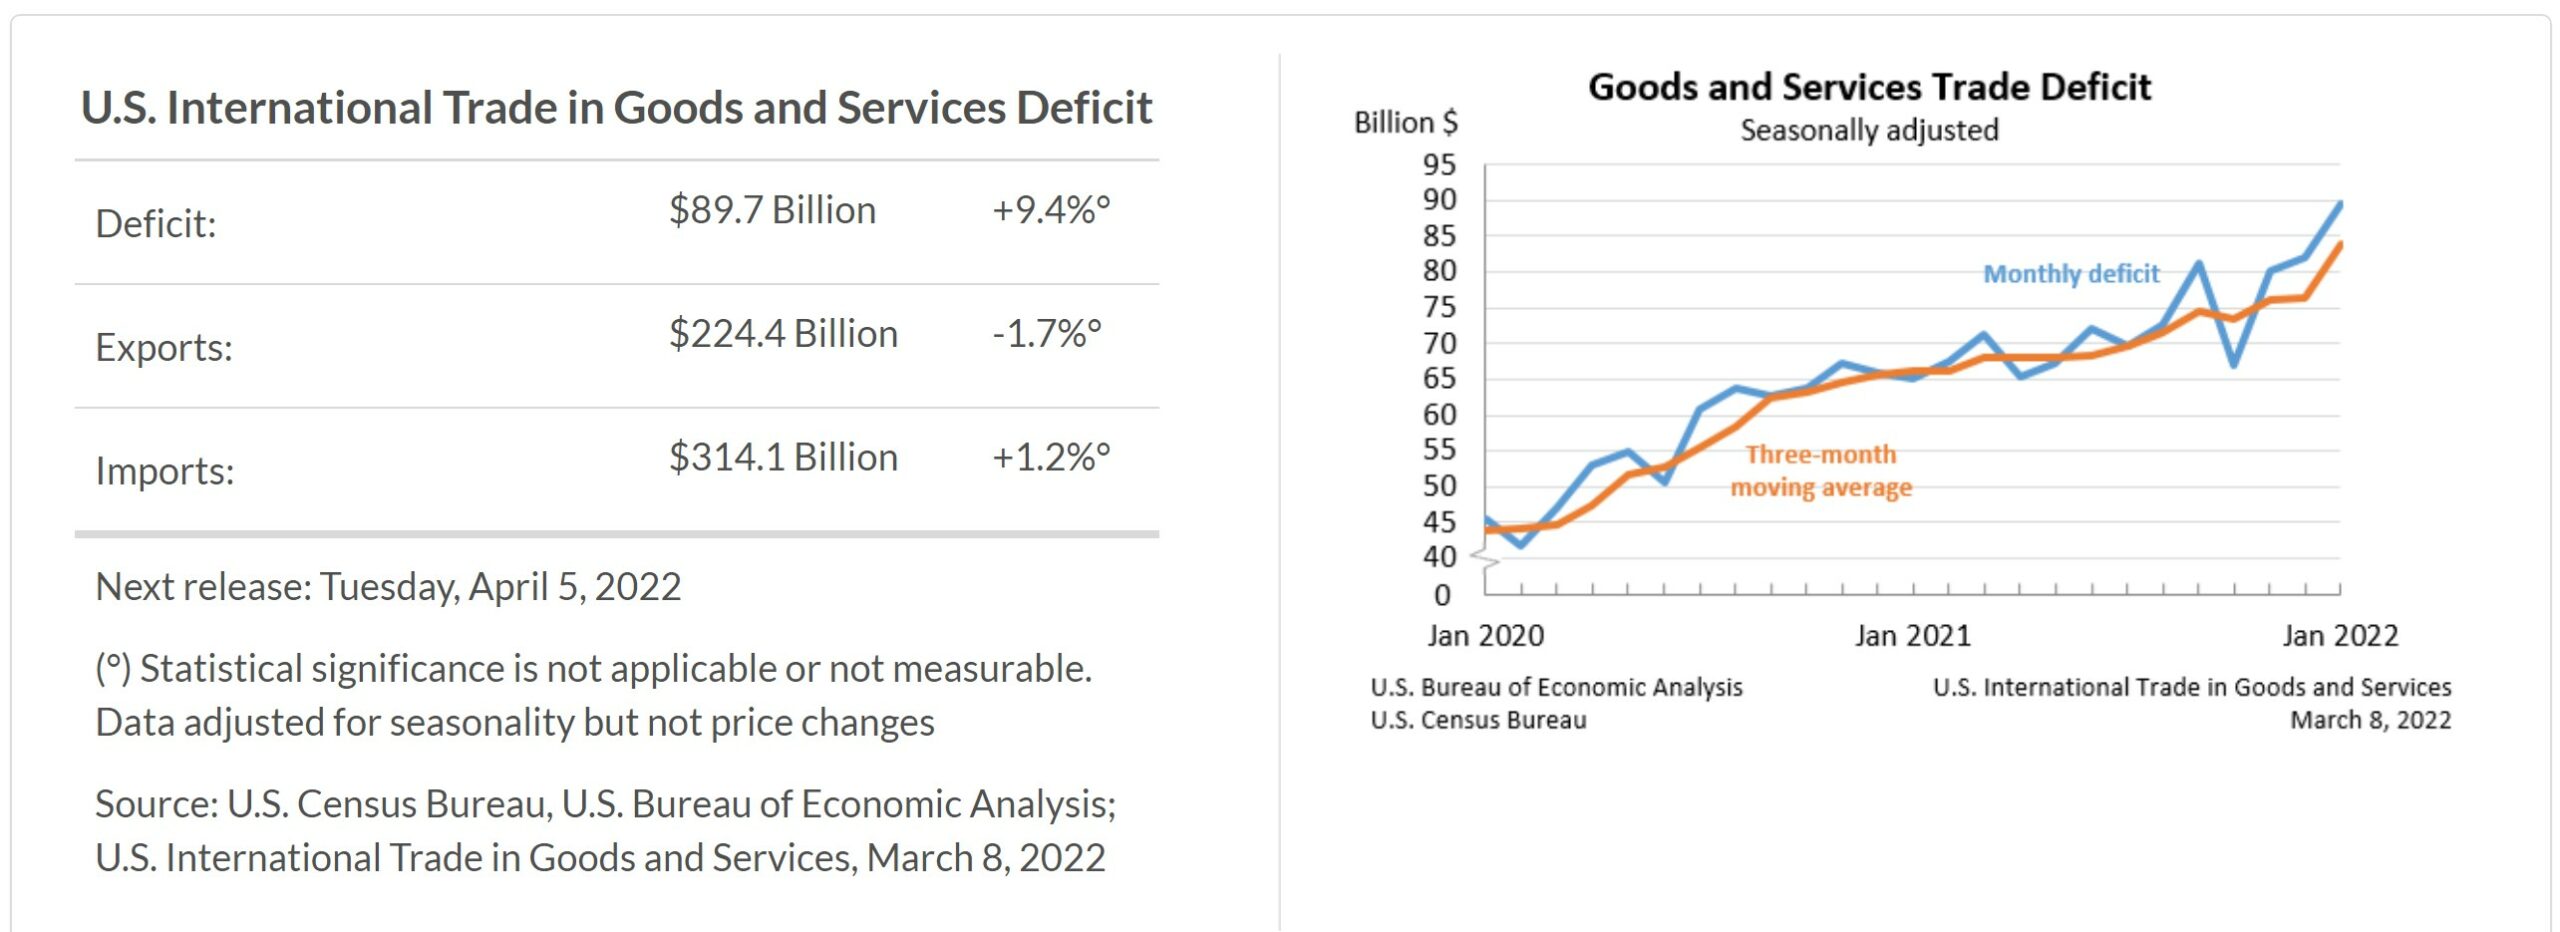
US Trade Deficit Rose 9.4% to a Record High in January After December Deficit Revised Higher
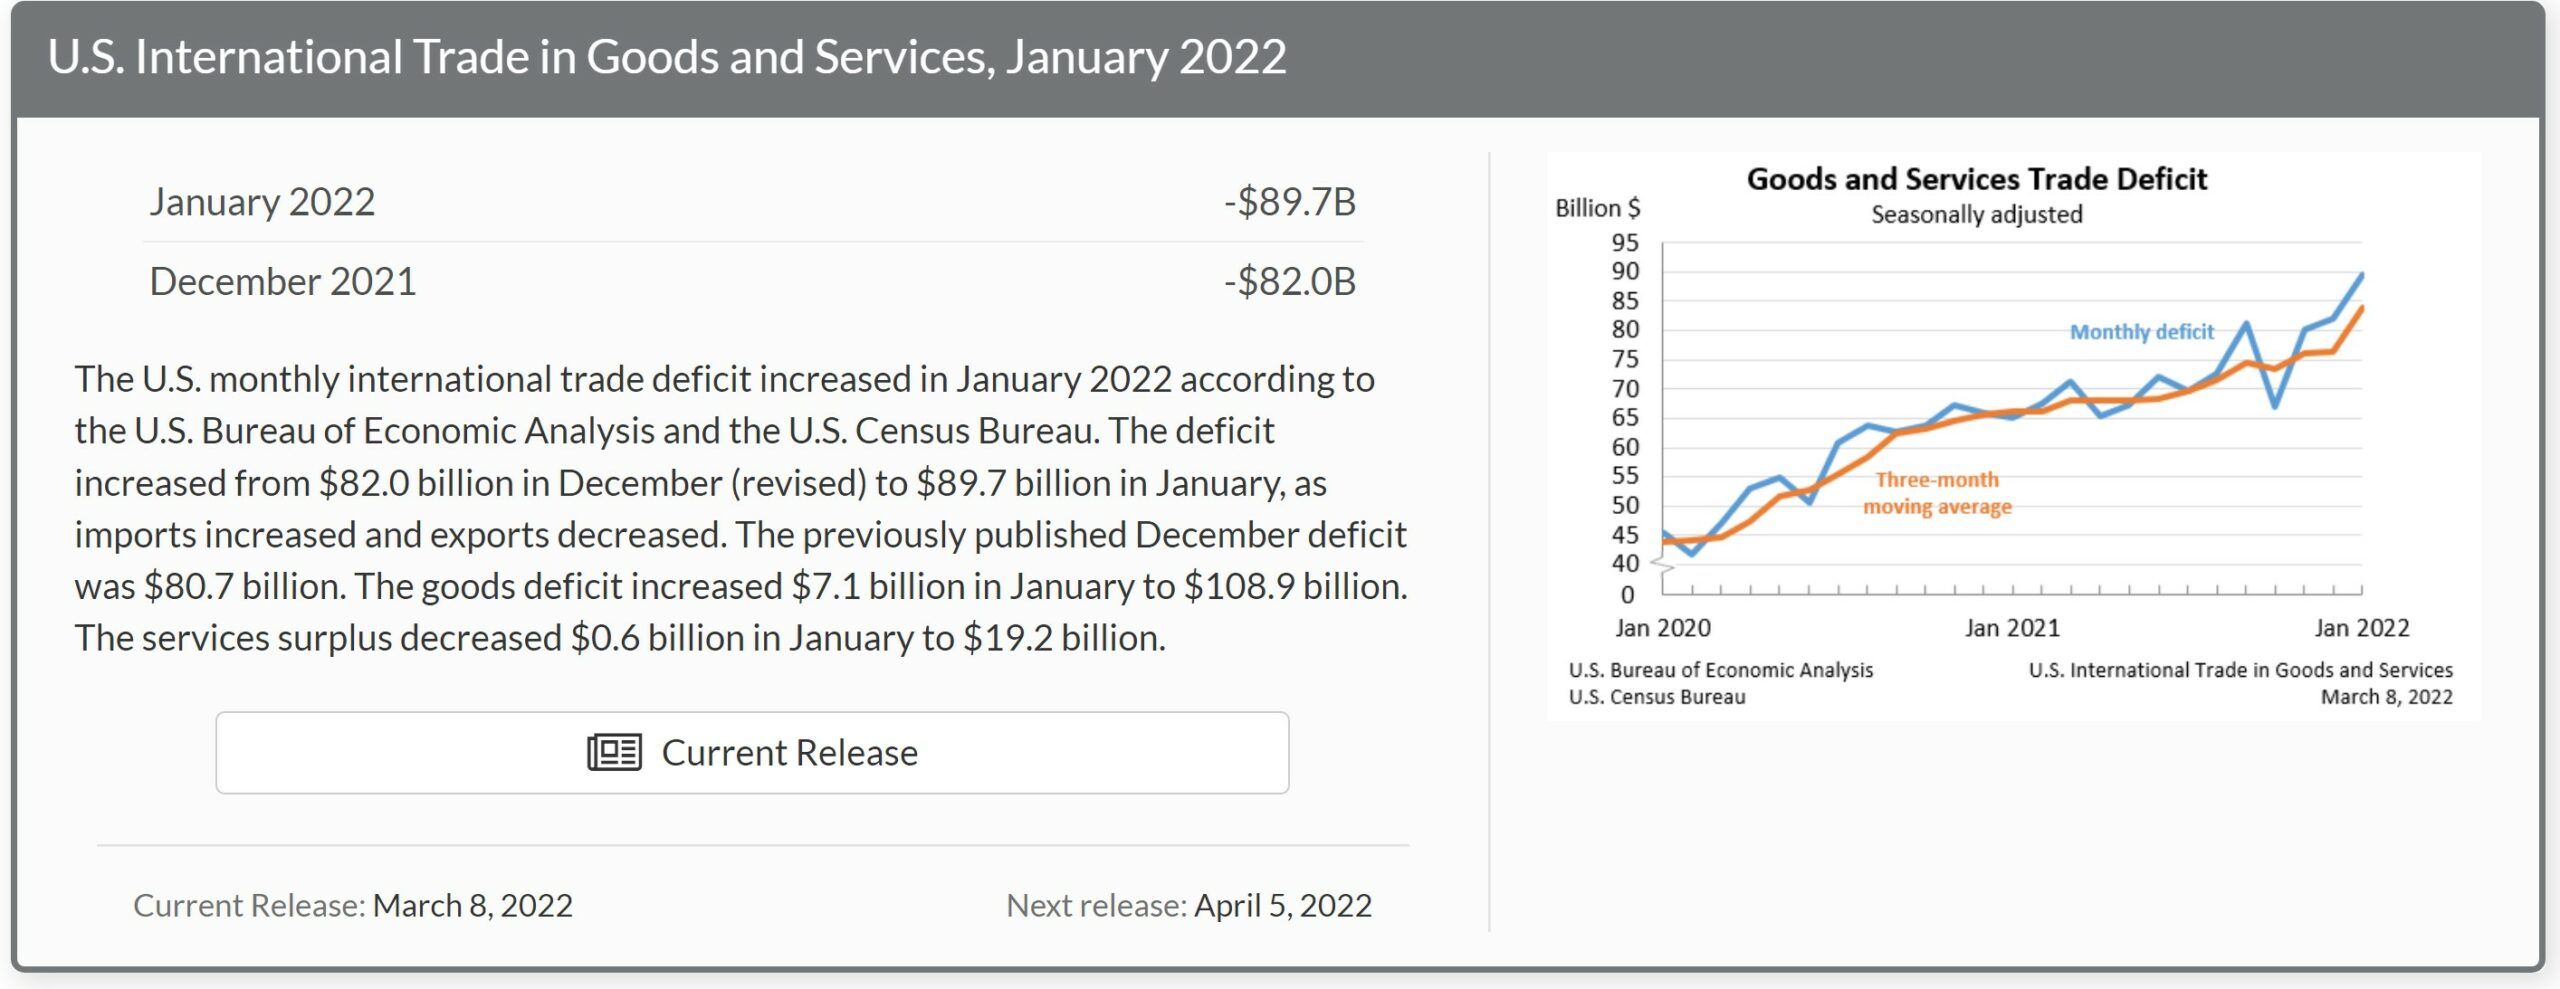
Our trade deficit rose 9.4% in January, as the value of our exports decreased while the value of our imports increased . . . the Commerce Dept report on our international trade in goods and services for January indicated that our seasonally adjusted goods and services trade deficit rose by a rounded $7.7 billion to a rounded $89.7 billion in January, from a December deficit that was revised up from $80.7 billion to $82.0 billion, while all prior monthly trade deficit figures for 2021 were revised as well . . . the value of our January exports fell by $3.9 billion to $224.4 billion on a $2.3 billion decrease to $155.9 billion in our exports of goods and a decrease of $1.6 billion to $68.5 billion in our exports of services, while our imports rose by $3.8 billion to $314.1 billion as a $4.8 billion increase to $264.8 billion in our imports of goods was partly offset by a $1.0 billion decrease to $49.3 billion in our imports of services . . . export prices averaged 2.9% higher in January, which means the relative real decrease in exports for the month was greater than the nominal decrease by that percentage, while import prices averaged 2.0% higher, meaning the increase in real imports was smaller than the nominal dollar decrease reported here by that percentage.
The decrease in our January exports of goods largely resulted from lower exports of consumer goods, which was partly offset by greater exports of capital goods . . . referencing the Full Release and Tables for January (pdf), in Exhibit 7 we find that our exports of consumer goods decreased by $2,967 million to $18,970 million on a $2,343 million decrease in our exports of pharmaceuticals, which in turn was partly offset by $371 million increase in our exports of gem diamonds, and that our exports of automotive vehicles, parts and engines fell by $659 million to $12,336 million on a $293 million decrease in our exports of trucks, buses, and special purpose vehicles and a $219 million decrease in our exports of passenger cars, while our exports of other goods not categorized by end use fell by $198 million to $5,700 million . . . partially offsetting the decreases in those end use categories, our exports of capital goods rose by $1,091 million to $46,113 million even as a $445 million increase in our exports of civilian aircraft was more than offset by a $543 million decrease in our exports of engines for civilian aircraft, and our exports of industrial supplies and materials rose by $450 million to $48,022 million, led by a $386 million increase in our exports of organic chemicals, while our exports of foods, feeds and beverages rose by $2 million to $14,122 million as a $692 million decrease in our exports of soybeans was offset by increases in our exports of corn, meat, poultry, and wheat…
Exhibit 8 in the Full Release and Tables gives us seasonally adjusted details on our January goods imports and shows that the January increase in our imports was due to higher imports of almost everything, led by increasing imports of automotive products, industrial supplies and materials, foods feeds, and beverages, and of capital goods . . . our imports of automotive vehicles, parts and engines rose by $1,583 million to $32,519 million on a $778 million increase in our imports of passenger cars and a $470 million increase in our imports of automotive parts other than engines, chassis, and tires, and our imports of industrial supplies and materials rose by $1,544 million to $61,828 million on a $935 increase in our imports of crude oil, a $382 million increase in our imports of natural gas, a $567 million increase in our imports of copper and a $408 million increase in our imports of inorganic chemicals other that those itemized separately . . . in addition, our imports of foods, feeds, and beverages rose by $1,356 million to $17,061 million on increases in our imports of meat products, fruits and frozen juices, fish and shellfish, and other foods, and our imports of capital goods rose by $1,066 million to $68,762 million on a $341 million increase in our imports of telecommunications equipment and a $336 million increase in our imports of industrial machines other than those listed separately . . . moreover, our imports of consumer goods increased by $669 million to $72,564 million as a $879 million increase in our imports of pharmaceutical preparations, a $469 million increase in our imports of photo equipment, and a $346 million increase in our imports of gem diamonds were partly offset by a $516 million decrease in our imports of apparel and textiles other than those of wool or cotton, a $424 million decrease in our imports of cotton apparel and household goods, a $320 million decrease in our imports of toys, games, and sporting goods, and a $306 million decrease in our imports of footwear, while our imports of other goods not categorized by end use fell by $1,609 million to $10,101 million…
The Press Release for this month’s report also summarizes Exhibit 19 in the full pdf, which gives us surplus and deficit details on our goods trade with selected countries…
The January figures show surpluses, in billions of dollars, with South and Central America ($4.4), Hong Kong ($2.0), Singapore ($1.3), Brazil ($1.1), and United Kingdom ($1.0). Deficits were recorded, in billions of dollars, with China ($33.3), European Union ($18.0), Mexico ($12.5), Japan ($7.1), Canada ($6.8), Germany ($5.4), Taiwan ($3.9), Italy ($3.2), South Korea ($3.0), India ($2.4), Saudi Arabia ($0.8), and France ($0.8).
- The deficit with Canada increased $2.6 billion to $6.8 billion in January. Exports decreased $1.2 billion to $27.7 billion and imports increased $1.4 billion to $34.5 billion.
- The deficit with Japan increased $2.1 billion to $7.1 billion in January. Exports increased $0.1 billion to $6.2 billion and imports increased $2.2 billion to $13.4 billion.
- The deficit with India decreased $1.5 billion to $2.4 billion in January. Exports increased $0.6 billion to $4.3 billion and imports decreased $0.9 billion to $6.7 billion.
To gauge the impact of January trade on 1st quarter GDP growth figures, we use exhibit 10 in the pdf for this report, which gives us monthly goods trade figures by end use category and in total, already adjusted for inflation in chained 2012 dollars, the same inflation adjustment that’s used by the BEA to compute trade figures for GDP, with the only difference being that the amounts given here are not annualized. From that table, we can figure that the 4th quarter’s real exports of goods averaged 151,506.3 million monthly in chained 2012 dollars, while inflation adjusted January goods exports were at 147,208 million in that same 2012 dollar quantity index representation . . . computing the annualized change between those two figures, we find that January’s real exports of goods are thus falling at a 10.87% annual rate from those of the 4th quarter, or at a pace that would subrtract about 0.77 percentage points from 1st quarter GDP growth if continued at the same pace through February and March . . . in a similar manner, we find that our 4th quarter real imports of goods averaged 263,027 million monthly in chained 2012 dollars, while inflation adjusted goods imports in January were at 265,282 million in 2012 dollars . . . that would indicate that so far in the 1st quarter, we have seen our real imports of goods increase at a 3.47% annual rate from those of the 4th quarter . . . since an increase in imports would subtract from GDP because it would represent the portion of consumption or investment that occurred during the quarter that was not produced domestically, that increase at a 3.47% rate would subtract roughly 0.40 more percentage points from 1st quarter GDP . . . hence, if our January trade in goods deficit is maintained at the same level throughout the rest of the 1st quarter, the deterioration in our balance of trade in goods would subtract about 1.17 percentage points from the growth of our 1st quarter GDP . . . while we have not computed the impact of the change in international trade in services here, we’d note that our exports of services fell by $1.6 billion in January, while our imports of services fell by $1.0 billion, so the impact of the month’s services trade on GDP should be negative as well.
Also note that both exports and imports were revised from July through December to incorporate more comprehensive and updated quarterly and monthly data; in addition, the seasonally adjusted data for all months of 2021 were revised so that the totals of the seasonally adjusted months equaled the annual totals…the obvious impact of these revisions will be to necessitate the revision of GDP figures for each quarter of 2021; however, for quarters other than the 4th, which still has another estimate due out at the end of this month, those GDP revisions will not be applied until the annual GDP revisions are released, which won’t be until the last week of July.