RJS, Focus on Fracking, Largest one-week price jump on record leaves oil prices at a 13½ year high Oil prices increased for the tenth time in eleven weeks this week, and finished at a 13 1/2 year high, after a combination of sanctions, the threat of sanctions, and threats to shipping in the Black Sea had taken more than half of Russian oil off the market . . . after ending last week up 1.5% at .59 a barrel after earlier hitting 0 with the onset of war in Ukraine, the contract price for US light sweet crude for April delivery opened more than 3% higher on Monday, after the U.S. and Western allies imposed sanctions on Russian banks, prompting fears that payment for oil exports would be affected, and quickly spiked more than 7% to trade above
Topics:
Angry Bear considers the following as important: Oil, Oil at 13-1/2 Year High, US/Global Economics
This could be interesting, too:
Joel Eissenberg writes How Tesla makes money
Angry Bear writes True pricing: effects on competition
Angry Bear writes The paradox of economic competition
Angry Bear writes USMAC Exempts Certain Items Coming out of Mexico and Canada
RJS, Focus on Fracking, Largest one-week price jump on record leaves oil prices at a 13½ year high
Oil prices increased for the tenth time in eleven weeks this week, and finished at a 13 1/2 year high, after a combination of sanctions, the threat of sanctions, and threats to shipping in the Black Sea had taken more than half of Russian oil off the market . . . after ending last week up 1.5% at $91.59 a barrel after earlier hitting $100 with the onset of war in Ukraine, the contract price for US light sweet crude for April delivery opened more than 3% higher on Monday, after the U.S. and Western allies imposed sanctions on Russian banks, prompting fears that payment for oil exports would be affected, and quickly spiked more than 7% to trade above $99 per barrel, before settling 4.5%, or $4.13, higher at $95.72 per barrel after an initial round of talks between Russia and Ukraine concluded without an agreement and Russian forces continued their offensives on the Ukraine’s two largest cities . . . oil prices opened more than 3% higher again on Tuesday, after reports suggested a rapid escalation in Russia’s assault on Ukrainian metropolitan areas, with indiscriminate shelling of the second largest Ukrainian city of Kharkiv — a shift that could open the door for deeper involvement of Western allies in a confrontation with the world’s leading nuclear power, and continued to surge to finish the session $7.69 higher at $103.41 a barrel, as a decision by the U.S. and other major economies to release emergency stockpiles failed to ease concerns of a major shortfall in supplies . . . oil prices surged to highs not seen in more than a decade early Wednesday, after OPEC and its oil-producing allies, which included Russia, decided to hold production steady thru April in an OPEC+ meeting that only lasted 13 minutes, their shortest meeting ever . . . oil prices then extended that surge later Wednesday, after the EIA reported across the board draws from crude and product inventories, and that oil stocks at the Cushing depot were near tank bottoms, before settling $7.19 higher at $110.60 a barrel on expectations that the market will remain short of supply for months to come, with no alternatives to Russian supply . . . oil opened higher again on Thursday and surged to a 14 year high at $116.57 a barrel, as trade disruption and shipping issues from Russian sanctions over the Ukraine crisis sparked supply worries, but then tumbled more than 8% to settle at $107.67 a barrel on signs Iran could have an imminent nuclear deal with the US to bring its crude supplies back on the market . . . however, oil prices again spiked to over $112 a barrel early Friday after reports of a fire at a major Ukrainian nuclear power plant spooked markets before authorities later said the fire in an outbuilding had been extinguished. Prices then rallied further before the close as traders decided the impact of severe sanctions against Russia’s banking sector had already led to a structural disruption to global oil flows, before settling $8.01 higher at $115.68 a barrel, the highest closing price since mid-2008 . . . front month oil prices thus finished more than $24 or 26.3% higher, their greatest one week dollar value increase on record, with the global benchmark Brent trading in its widest range since the beginning of its futures trading in 1988...
With oil prices breaking out to a near 14 year high this week, we’ll include a few graphs of those prices below…the first one will show oil prices over the past 20 years (you can click on it for a better view):
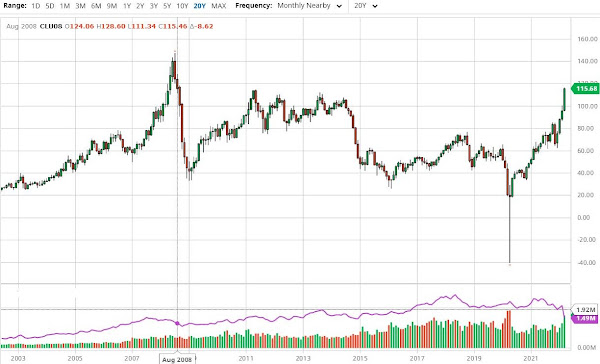
The above is a screenshot of the current interactive and continuously updated oil price chart from barchart.com, which I have set to show front month oil prices monthly over the past 20 years, which means you’re seeing the same range of oil prices that were quoted by the media over that stretch. This interactive chart can also be reset to show prices of front month or individual monthly oil contracts over time periods ranging from 1 day to 30 years, as the menu bar on the top indicates, and also show oil prices by the minute, hour, day, week or month. Each bar in the graph above represents the range of oil prices for a single month, with months when prices rose indicated in green, with the opening price at the bottom of the bar and the closing price at the top, and months when prices fell indicated in red, with the opening price at the top of the bar and the closing price at the bottom, while the small sticks above or below each monthly bar represent the extent of the price change above or below the opening and closing price during the month in question . . . meanwhile, the bars across the bottom show trading volume for the front month oil contract for the months in question, again with up months indicated by green bars and down months indicated in red . . . by setting my cursor over August 2008, when prices were last this high, i was able to bring up a readout of those August 2008 prices in the upper left of the graph . . . there you can see that prices opened at $124.06 a barrel at the beginning of trading that month, rose to as high as $128.60 a barrel during that August before falling to a low of $111.34 a barrel, and then closed at $115.46 a barrel on the last trading day of August 2008 . . . since oil prices have only been lower thereafter, that establishes this week’s $115.68 close as the highest oil price since, and hence a 13 1/2 year high . . .
What is also particularly noteworthy on the graph above is the downward price spike of April 2020, when US oil prices (at Cushing Oklahoma) fell to negative $40.32 a barrel in the wake of the pandemic and an OPEC squabble . . . oil prices went negative because Cushing storage was full at contract expiration that month, and no one would take the oil that was available . . . since oil closed this week priced at $115.68, that means US oil prices have risen $156 a barrel in a little less than 2 years . . .
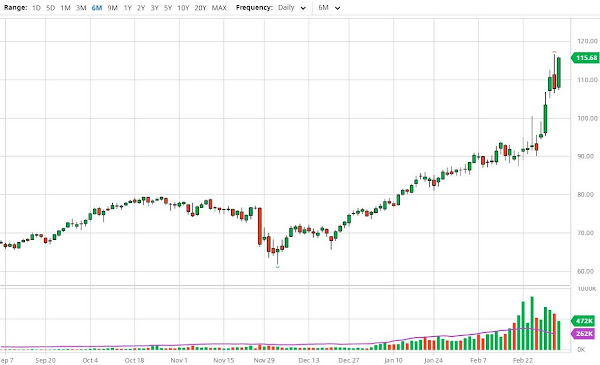
The next graph we’re including here is formatted the same way as the one above, but instead of showing monthly oil prices for 20 years, this one shows daily oil prices for six months . . . we include this graph so you can see that oil prices actually hit their high for this past week on Thursday, when they spiked to $116.57 in early trading before falling all the way back to $107.67 a barrel in the wake of the Iran treaty news . . . you can see that price spike as an upward pointing “wick” above the red bar representing Thursday’s falling prices on the right side of the graph . . .
Natural gas prices also finished higher this week, following Europe’s gas prices higher after first rising on a colder forecast for mid-March . . . after rising 2.1% to $4.470 per mmBTU last week on rocketing European gas prices and on a spate of natural gas well freeze-offs, the contract price of natural gas for April delivery opened more than 3% higher on Monday on intensifying concerns regarding the Russia-Ukraine conflict but reversed to settle 6.8 cents lower at $4.402 per mmBTU, as traders focused on forecasts for less cold American weather over the next two weeks, rather than worries that escalating sanctions against Russia would disrupt global energy supplies . . . but natural gas prices bounced back Tuesday amid potential for even stronger demand for U.S. LNG exports against the backdrop of Ukraine and the specter of European supply disruptions, and settled 17.1 cents or nearly 4% higher at $4.573 per mmBTU . . . natural gas rose another 18.9 cents to $4.762 on Wednesday, gaining support from surging global oil and gas prices, as the Russia-Ukraine conflict stoked energy supply concerns . . . US natural gas prices eased on Thursday, despite a triple digit withdrawal from storage, and settled down 4.0. cents at 4.722 per mmBTU, after the European benchmark price dropped as much as 22%, after soaring over 100% since the Ukrainian invasion on February 24 . . . but natural gas prices jumped more than 6% to a one-month high on Friday, buoyed by global supply fears imposed by Russia’s invasion of Ukraine, resurging European prices and the related prospect of a protracted period of record demand for U.S. liquefied natural gas, and settled 29.4 cents higher at $5.016 per mmBTU, thus logging a 12.2% increase on the week..
The EIA’s natural gas storage report for the week ending February 25th indicated that the amount of working natural gas held in underground storage in the US fell by 139 billion cubic feet to 1,643 billion cubic feet by the end of the week, which left our gas supplies 216 billion cubic feet, or 11.6% below the 1,859 billion cubic feet that were in storage on February 25th of last year, and 255 billion cubic feet, or 13.4% below the five-year average of 1,898 billion cubic feet of natural gas that have been in storage as of the 25th of February over the most recent five years . . . the 139 billion cubic foot withdrawal from US natural gas working storage for the cited week was close the average forecast for a 137 billion cubic foot withdrawal expected by an S&P Global Platts survey of analysts, but it was more than the 132 billion cubic feet that were pulled from natural gas storage during the corresponding week of 2021, and was much more than the average withdrawal of 98 billion cubic feet of natural gas that have typically been pulled out natural gas storage during the same week over the past 5 years…