RJS, Focus on Fracking Summary: Strategic Petroleum Reserve at a 21-year low, distillates supply at a 17-year low The Latest US Oil Supply and Disposition Data from the EIA US oil data from the US Energy Information Administration for the week ending May 6th indicated that after another drop in our oil exports, another oil withdrawal from the SPR, and an increase in oil that could not be accounted for, we again had oil to add to our stored commercial crude supplies, for the 10th time in 24 weeks and for the 19th time in the past forty-nine weeks . . . our imports of crude oil fell by an average of 62,000 barrels per day to an average of 6,269,000 barrels per day, after rising by an average of 397,000 barrels per day during the prior week,
Topics:
Angry Bear considers the following as important: Focus on Fracking, Hot Topics, RJS, US/Global Economics
This could be interesting, too:
NewDealdemocrat writes JOLTS revisions from Yesterday’s Report
Joel Eissenberg writes No Invading Allies Act
Joel Eissenberg writes How Tesla makes money
NewDealdemocrat writes January JOLTS report: monthly increases, but significant downward revisions to 2024
RJS, Focus on Fracking
Summary: Strategic Petroleum Reserve at a 21-year low, distillates supply at a 17-year low
The Latest US Oil Supply and Disposition Data from the EIA
US oil data from the US Energy Information Administration for the week ending May 6th indicated that after another drop in our oil exports, another oil withdrawal from the SPR, and an increase in oil that could not be accounted for, we again had oil to add to our stored commercial crude supplies, for the 10th time in 24 weeks and for the 19th time in the past forty-nine weeks . . . our imports of crude oil fell by an average of 62,000 barrels per day to an average of 6,269,000 barrels per day, after rising by an average of 397,000 barrels per day during the prior week, while our exports of crude oil fell by 695,000 barrels per day to 2,879,000 barrels per day during the week, which together meant that our trade in oil worked out to a net import average of 3,390,000 barrels of oil per day during the week ending May 6th, 633,000 more barrels per day than the net of our imports minus our exports during the prior week . . . over the same period, production of crude oil from US wells was reportedly 100,000 barrels per day lower at 11,800,000 barrels per day, and hence our daily supply of oil from the net of our international trade in oil and from domestic well production appears to have totaled an average of 15,190,000 barrels per day during the cited reporting week…
Meanwhile, US oil refineries reported they were processing an average of 15,696,000 barrels of crude per day during the week ending May 6th, an average of 230,000 more barrels per day than the amount of oil than our refineries processed during the prior week, while over the same period the EIA’s surveys indicate that a net of 214,000 barrels of oil per day were being added to the supplies of oil stored in the US . . . so based on that reported & estimated data, this week’s crude oil figures from the EIA appear to indicate that our total working supply of oil from net imports and from oilfield production was 719,000 barrels per day less than what was added to storage plus what our oil refineries reported they used during the week . . . to account for that disparity between the apparent supply of oil and the apparent disposition of it, the EIA just inserted a (+719,000) barrel per day figure onto line 13 of the weekly U.S. Petroleum Balance Sheet in order to make the reported data for the daily supply of oil and for the consumption of it balance out, a fudge factor that they label in their footnotes as “unaccounted for crude oil”, thus suggesting there must have been an error or omission of that magnitude in this week’s oil supply & demand figures that we have just transcribed . . . however, since most everyone treats these weekly EIA reports as gospel, and since these figures often drive oil pricing, and hence decisions to drill or complete oil wells, we’ll continue to report this data just as it’s published, and just as it’s watched & believed to be reasonably accurate by most everyone in the industry . . . (for more on how this weekly oil data is gathered, and the possible reasons for that “unaccounted for” oil, see this EIA explainer)….
This week’s 214,000 barrel per day rounded increase in our overall crude oil inventories came as 1,212,000 barrels per day were being added to our commercially available stocks of crude oil, while 999,000 barrels per day of oil were being pulled out of our Strategic Petroleum Reserve at the same time . . . that draw on the SPR now appears to include the initial emergency withdrawal under Biden’s “Plan to Respond to Putin’s Price Hike at the Pump”, that is expected to supply 1,000,000 barrels of oil per day to commercial interests from now up to the midterm elections in November, in the hope of keeping gasoline and diesel fuel prices from rising further up until that time, as well as the previous 30,000,000 million barrel release from the SPR to address Russian supply related shortfalls, and the administration’s earlier plan to release 50 million barrels from the SPR to incentivize US gasoline consumption….since both the press releases from the administration on the SPR releases and the news coverage of them has been less than clear, we’ll include here a copy of the SPR release schedule that the Congressional Research Service prepared for members of Congress, so that they’d be able to front-run Energy Department oil releases in their own trading accounts…

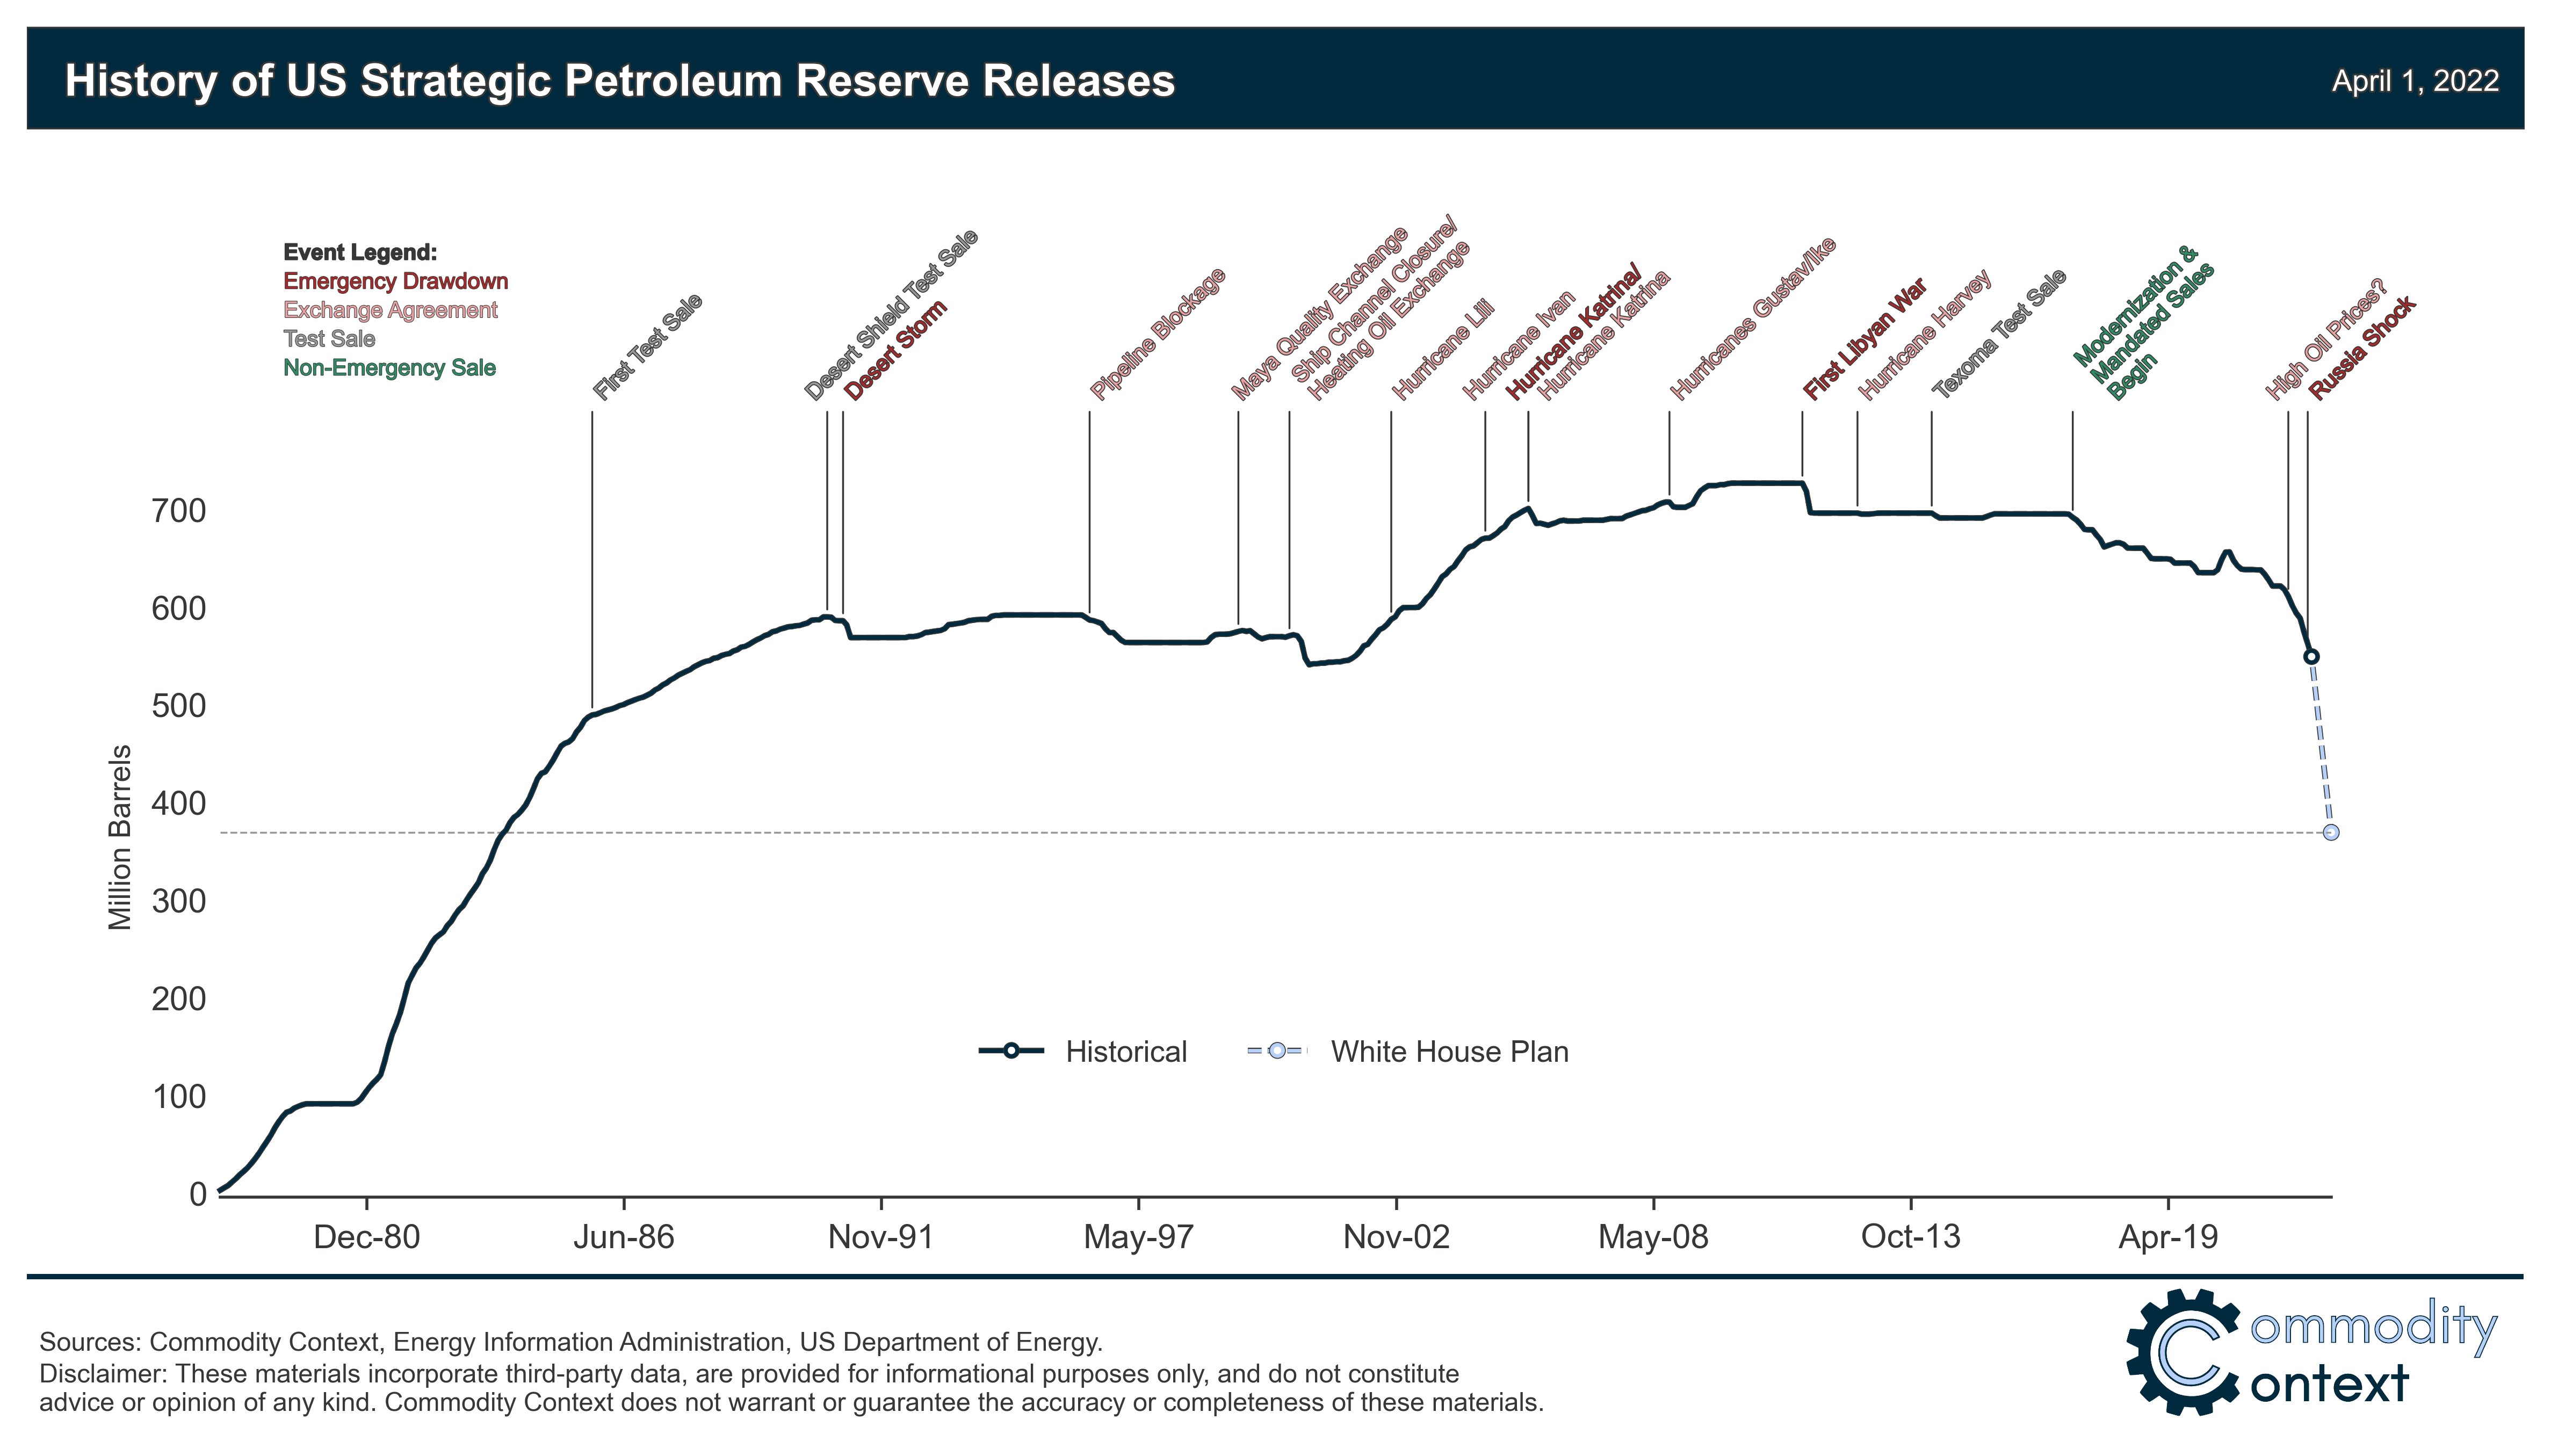
The Biden administration’s releases from the SPR fall under 3 categories, as shown above…the initial Biden SPR release was a combination of a mandatory sale and an exchange, wherein the oil companies receiving oil from the SPR would be expected to pay it back, while the most recent SPR release was categorized as an emergency sale, meant to accompany sanctions we had imposed on Russian oil in the wake of the Ukraine situation . . . including other withdrawals from the Strategic Petroleum Reserve under recent release programs, a total of 113,155,000 barrels of oil have now been removed from the Strategic Petroleum Reserve over the past 22 months, and as a result the 542,994,000 barrels of oil still remaining in our Strategic Petroleum Reserve is now the lowest since May 4th, 2001, or at a 21 year low, as repeated tapping of our emergency supplies for non-emergencies or to pay for other programs has already drained those supplies considerably over the past dozen years….so now, the total 180,000,000 barrel drawdown over the next six months will remove almost a third of what remains in the SPR, and leave us with what would be less that a 20 day supply of oil at today’s consumption rate, as the following graph illustrates…

The above graph comes from a post by oil and gas researcher Rory Johnston at Substack, wherein he discusses the implications of the million barrel per day SPR release, and it shows the historical quantity of oil held in our Strategic Petroleum Reserve, beginning from its inception following the Arab Oil Embargo of 1973-74 to the present day . . . the graph is further annotated to indicate the reasons for major additions to and withdrawals from the SPR, most of which were due to disruptions to oil supplies following hurricanes in the Gulf (you can get a better view of those annotations by clicking on the graph, or even better yet, view the enlarged original at substack.com . . . on the far right, Rory has projected where the strategic petroleum Reserve will end up after the Biden withdrawals are complete, which will take the SPR back to its level of 1983, while it was still being filled . . . based on an estimated average daily US oil consumption of 18,000,000 barrels per day, the US will have roughly 18 1/2 days of oil supply left in the Strategic Petroleum Reserve this November, after all three of the Biden administration’s SPR with-drawal programs have run their course …
Further details from the weekly Petroleum Status Report (pdf) indicate that the 4 week average of our oil imports rose to an average of 6,093,000 barrels per day last week, which was 6.2% more than the 5,740,000 barrel per day average that we were importing over the same four-week period last year . . . this week’s crude oil production was reported to be 100,000 barrels per day lower at 11,800,000 barrels per day even though the EIA’s rounded estimate of the output from wells in the lower 48 states was unchanged at 11,400,000 barrels per day, because Alaska’s oil production fell by 7,000 barrels per day to 447,000 barrels per day and subtracted 100,000 barrels per day from the final rounded national total (that’s the EIA’s math, not mine) . . . US crude oil production had reached a pre-pandemic high of 13,100,000 barrels per day during the week ending March 13th 2020, so this week’s reported oil production figure was 9.9% below that of our pre-pandemic production peak, but was 40.0% above the interim low of 8,428,000 barrels per day that US oil production had fallen to during the last week of June of 2016…
US oil refineries were operating at 90.0% of their capacity while using those 15,696,000 barrels of crude per day during the week ending May 6th, up from the 88.4% utilization rate of the prior week, but still below the historical utilization rate for early May refinery operations . . . the 15,696,000 barrels per day of oil that were refined this week were 4.5% more barrels than the 15,020,000 barrels of crude that were being processed daily during week ending May 7th of 2021, when refineries were still recovering from winter storm Uri, and 21.0% more than the 12,976,000 barrels of crude that were being processed daily during the week ending May 8th, 2020, when US refineries were operating at what was then a much lower than normal 70.5% of capacity during the first wave of the pandemic, but still 4.3% less than the 16,405,000 barrels that were being refined during the pre-pandemic week ending May 3rd 2019, when refinery utilization was also at a somewhat below normal 88.9% for the first weekend of May…
With the increase in the amount of oil being refined this week, gasoline output from our refineries was a bit higher, increasing by 27,000 barrels per day to 9,716,000 barrels per day during the week ending May 6th, after our gasoline output had increased by 175,000 barrels per day over the prior week.…this week’s gasoline production was 1.3% more than the 9,588,000 barrels of gasoline that were being produced daily over the same week of last year, but 4.1% below our gasoline production of 10,129,000 barrels per day during the week ending May 3rd, 2019, ie, the year before the pandemic impacted gasoline output . . . at the same time, our refineries’ production of distillate fuels (diesel fuel and heat oil) increased by 163,000 barrels per day to 4,882,000 barrels per day, after our distillates output had decreased by 63,000 barrels per day over the prior week . . . after that increase, our distillates output was 4.9% more than the 4,655,000 barrels of distillates that were being produced daily during the week ending May 7th of 2021, but 4.1% less that the 5,089,000 barrels of distillates that were being produced daily during the week ending May 3rd, 2019…
Even with the recent increases in our gasoline production, our supplies of gasoline in storage at the end of the week fell for the thirteenth time in fourteen weeks, decreasing by 3,607,000 barrels to 224,968,000 barrels during the week ending May 6th,after our gasoline inventories had decreased by 2,230,000 barrels over the prior week . . . our gasoline supplies decreased again this week even though the amount of gasoline supplied to US users decreased by 154,000 barrels per day to 8,702,000 barrels per day, because our imports of gasoline fell by 432,000 barrels per day to 695,000 barrels per day while our exports of gasoline rose by 106,000 barrels per day to 942,000 barrels per day….but even with 13 inventory drawdowns over the past 14 weeks, our gasoline supplies were still only 4.8% lower than last May 7th’s gasoline inventories of 236,189,000 barrels, and 5% below the five year average of our gasoline supplies for this time of the year…
Even with this week’s increase in our distillates production, our supplies of distillate fuels decreased for the 14th time in seventeen weeks and for the 26th time in thirty-six weeks, falling by 913,000 barrels to a seventeen year low of 104,029,000 barrels during the week ending May 6th, after our distillates supplies had decreased by2,344,000 barrels to a 14 year low during the prior week . . . our distillates supplies fell again this week even though the amount of distillates supplied to US markets, an indicator of our domestic demand, fell by 179,000 barrels per day to 3,777,000 barrels per day, because our exports of distillates rose by 168,000 barrels per day to 1,357,000 barrels per day, and while our imports of distillates rose by 31,000 barrels per day to 122,000 barrels per day . . . after forty-one inventory with-drawals over the past fifty-seven weeks, our distillate supplies at the end of the week were 22.9% below the 136,153,000 barrels of distillates that we had in storage on May 7th of 2021, and about 23% below the five year average of distillates inventories for this time of the year…
The depressed level of our distillate supplies has led to diesel fuel and heat oil prices that have been $1 per gallon more than the already elevated price of gasoline, and both gasoline and diesel hit new record highs on NYMEX this week . . . supplies of diesel and pricing of it are also elevated in Europe and globally, leading to economic restrictions and power outages in countries that can’t afford it, such as Sri Lanka, Pakistan, and now India . . . because price of diesel for immediate delivery versus the next month widened to the largest ever gap last week, Gulf refiners found it more profitable to sell immediately to Europe than wait weeks for pipeline delivery to the US east coast, with those exports to Europe exacerbating domestic shortages . . . although those diesel shortages had developed over time, the loss of Russian oil has compounded the problem, because refineries get more diesel per barrel oil out of a heavy crude than they do from a light one, and most Russian oil exports are medium heavy sour crudes . . . that global shortage of diesel also explains the thinking behind the 1 million barrel per day SPR release better than the administration’s political messaging about gasoline prices . . . for US Gulf Coast and European refineries that were built to use a medium heavy crude like Russian Urals, they need to find an equivalent grade of crude to replace it, or do some expensive blending of other grades to match it…remember that the administration’s first frantic moves after the Russian oil ban were to try to get Venezuelan oil and even Iranian oil back on the market to replace it? . . . Since the US Strategic Petroleum Reserve is 60% heavier grades of crude, it appears that they’re pulling it out to partially replace embargoed Russian oil globally…most oil we get from shale is light and sweet, typically more expensive, but worthless when one is trying to replace Russian oil losses…
Meanwhile, with this week’s decrease in our oil exports and the big withdrawal from the SPR, our commercial supplies of crude oil in storage rose for the 17th time in 41 weeks and for the 20th time in the past year, increasing by 8,487,000 barrels over the week, from 415,727,000 barrels on April 29th to 424,214,000 barrels on May 6th, after our commercial crude supplies had increased by 1,303,000 barrels over the prior week . . . with this week’s increase, our commercial crude oil inventories rose to about 13% below the most recent five-year average of crude oil supplies for this time of year, and were still 19.3% above the average of our crude oil stocks as of the first weekend of May over the 5 years at the beginning of the past decade, with the disparity between those comparisons arising because it wasn’t until early 2015 that our oil inventories first topped 400 million barrels . . . since our crude oil inventories had jumped to record highs during the Covid lockdowns of spring 2020, and then jumped again after last year’s winter storm Uri froze off US Gulf Coast refining, our commercial crude oil supplies as of this May 6th were 12.5% less than the 484,691,000 barrels of oil we had in commercial storage on May 7th of 2021, and were also 20.2% less than the 531,476,000 barrels of oil that we had in storage on May 8th of 2020, and 9.1% less than the 466,604,000 barrels of oil we had in commercial storage on May 3rd of 2019…
Finally, with our inventories of crude oil and our supplies of all products made from oil remaining near multi year lows, we are also continuing to keep track of the total of all U.S. Stocks of Crude Oil and Petroleum Products, including those in the SPR . . . the EIA’s data shows that the total of our oil and oil product inventories, including those in the Strategic Petroleum Reserve and those held by the oil industry, and thus including everything from gasoline and jet fuel to propane/propylene and residual fuel oil, rose by 2,898,000 barrels this week, from 1,696,420,000 barrels on April 29th to 1,699,318,000 barrels on May 6th, after our total inventories had fallen by 479,000 barrels to a 13 1/3 year low during the prior week, and leaving our total liquids inventories still down by 89,115,000 barrels over the first 18 weeks of this year….