Initial claims continue weakening trend, but are not signaling recession this year Initial jobless claims declined -2,000 (from an upwardly revised 233,000), to 231,000 last week, vs. the 50+ year low of 166,000 set in March. The 4 week average rose further, by 7,250 to 231,750, compared with the all-time low of 170,500 twelve weeks ago. Continuing claims declined 3,000 (from an upwardly revised 1,331,00) to 1,328,000, which is 22,000 above their 50 year low set on May 6: Initial claims have been in an uptrend for nearly 3 months. If this continues one more week, they will no longer qualify as a “positive” in my array of short leading indicators, although they have not risen to levels that would change their rating to a negative.
Topics:
NewDealdemocrat considers the following as important: Hot Topics, jobless claims, New Deal Democrat, no recession yet, US EConomics
This could be interesting, too:
NewDealdemocrat writes JOLTS revisions from Yesterday’s Report
Joel Eissenberg writes No Invading Allies Act
Bill Haskell writes The North American Automobile Industry Waits for Trump and the Gov. to Act
Bill Haskell writes Families Struggle Paying for Child Care While Working
Initial claims continue weakening trend, but are not signaling recession this year
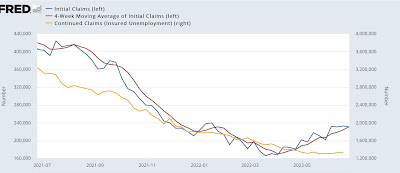
Initial jobless claims declined -2,000 (from an upwardly revised 233,000), to 231,000 last week, vs. the 50+ year low of 166,000 set in March. The 4 week average rose further, by 7,250 to 231,750, compared with the all-time low of 170,500 twelve weeks ago. Continuing claims declined 3,000 (from an upwardly revised 1,331,00) to 1,328,000, which is 22,000 above their 50 year low set on May 6:
Initial claims have been in an uptrend for nearly 3 months. If this continues one more week, they will no longer qualify as a “positive” in my array of short leading indicators, although they have not risen to levels that would change their rating to a negative.
Which brings up the issue, in this weak and deteriorating economy, just what would it take to flip this indicator to negative?
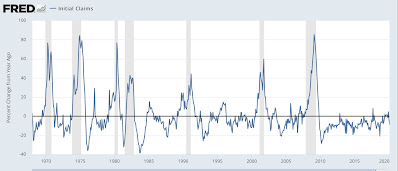
Four years ago in 2018, discussing a similar increase, I reviewed the entire 50+ year history of initial claims, concluding that “there are almost always one or two periods a year where the four week moving average of jobless claims rises between 5% and 10%. About once every other year for the past 50+ years, it rises over 10%. Typically (not always!) it has risen by 15% or more over its low before a recession has begun. And a longer term moving average of initial claims YoY has, with one exception, turned higher before a recession has begun.”
The first criterion can’t be graphed using FRED tools, but here’s what the second criterion looks like historically:

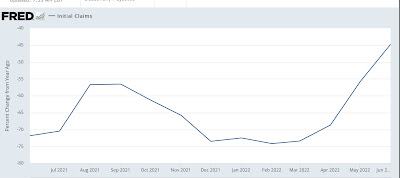
The current situation fulfills the first criterion, as claims are up about 35% from their *very* low starting point, but fails the second criterion. Claims are down roughly 45% from one year ago:

At the moment, claims have stabilized in the range of 230,000. At worst, the current uptrend in claims (so far!) is consistent with a potential 0.1% uptick in the unemployment rate going into autumn, which as I discussed last week, under the Sahm Rule it’s very unlikely that the unemployment rate will signal the onset of a recession during that time. Even if claims were to continue to rise from here on average about 4,000 a week (their average for the last 12 weeks), they would not turn negative YoY until November, which would be a short leading indicator for a recession thereafter.

