Coronavirus dashboard for August 9: BA.5 dominant, with a slow waning; a model for endemicity – by New Deal democrat BIobot’s most recent update, through last week, shows a decline of 15% of COVID in wastewater, consistent with about 460,000 “real” new infections per day: All 4 Census regions (not shown) are participating in the decline. Confirmed cases (dotted line below) have declined by a roughly similar percent, to 105,500. Deaths (solid line) are close to a 4 month peak at 489: Hospitalizations have plateaued for the past 3 weeks at about 44-47,000, and were 44,800 yesterday (the last year is shown for comparison purposes): Meanwhile, the CDC has updated its variant information. BA.4,4.6, and 5 now account for 98% of all
Topics:
NewDealdemocrat considers the following as important: BA.5 Covid, endemicity, Healthcare, New Deal Democrat, politics, US EConomics
This could be interesting, too:
Robert Skidelsky writes Lord Skidelsky to ask His Majesty’s Government what is their policy with regard to the Ukraine war following the new policy of the government of the United States of America.
NewDealdemocrat writes JOLTS revisions from Yesterday’s Report
Joel Eissenberg writes No Invading Allies Act
Ken Melvin writes A Developed Taste
Coronavirus dashboard for August 9: BA.5 dominant, with a slow waning; a model for endemicity
– by New Deal democrat
BIobot’s most recent update, through last week, shows a decline of 15% of COVID in wastewater, consistent with about 460,000 “real” new infections per day:
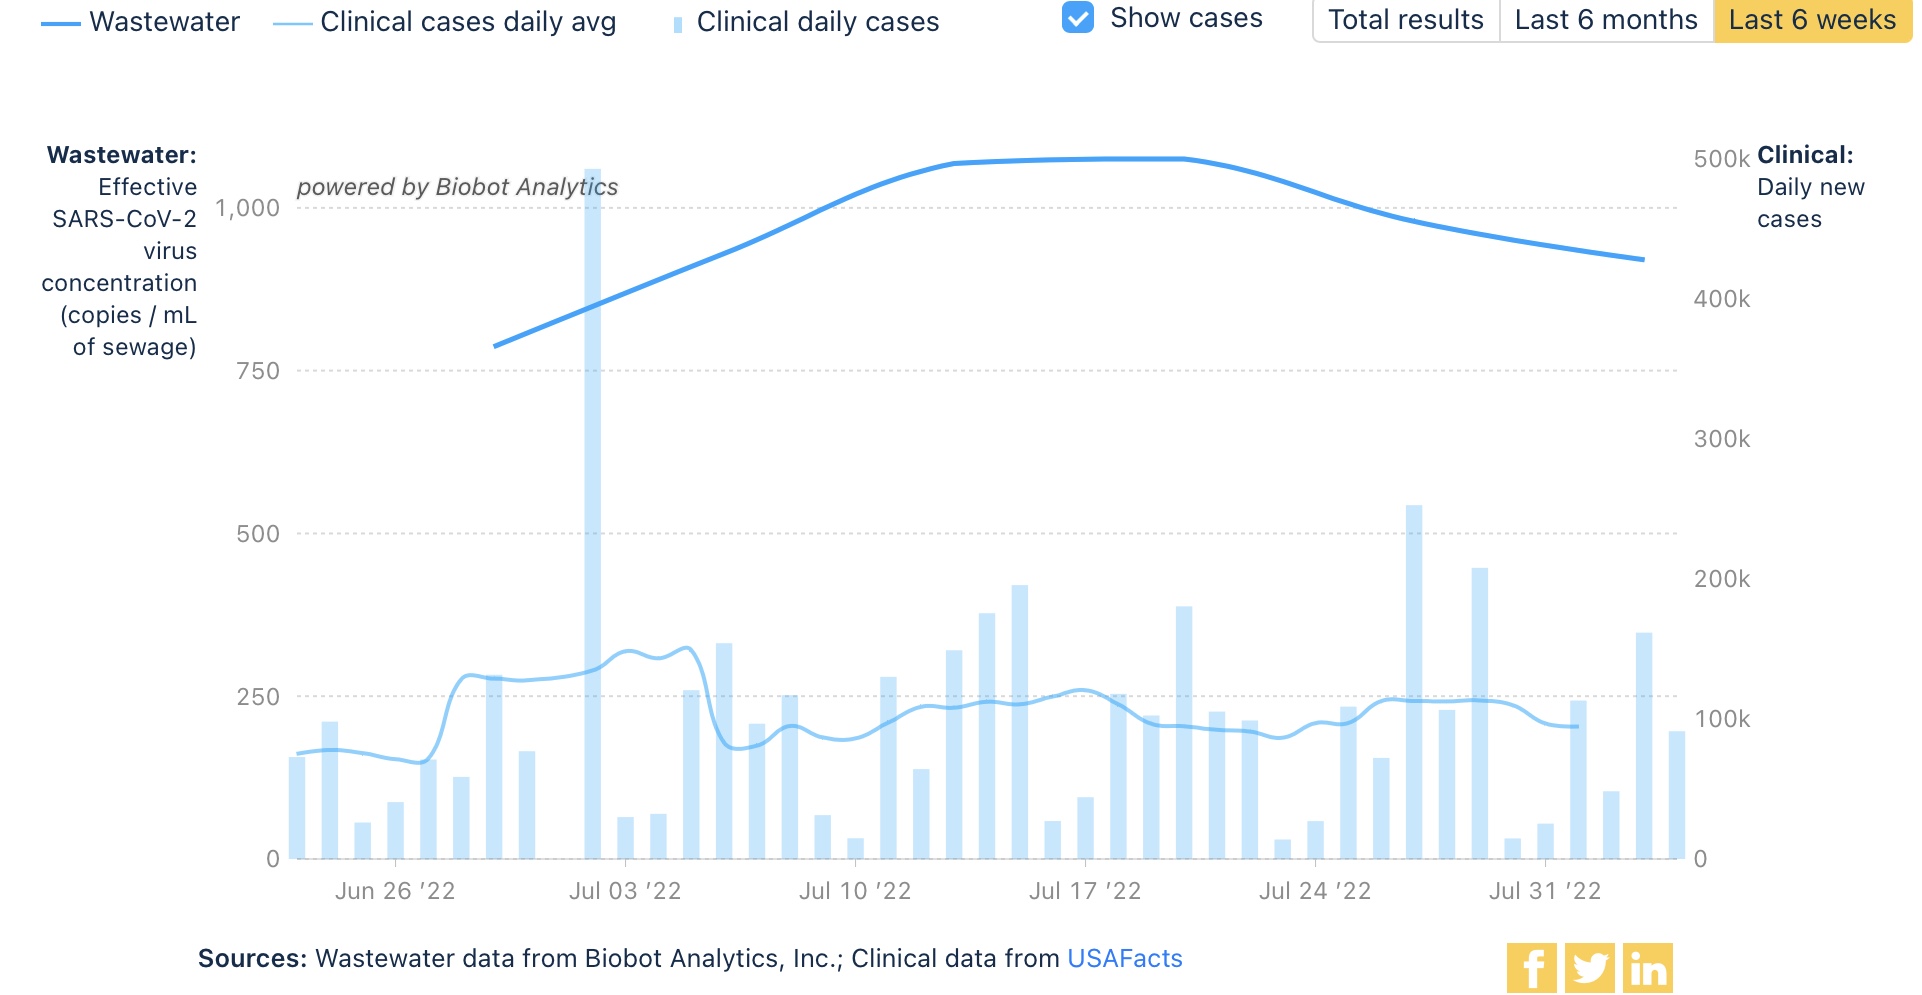
All 4 Census regions (not shown) are participating in the decline.
Confirmed cases (dotted line below) have declined by a roughly similar percent, to 105,500. Deaths (solid line) are close to a 4 month peak at 489:

Hospitalizations have plateaued for the past 3 weeks at about 44-47,000, and were 44,800 yesterday (the last year is shown for comparison purposes):

Meanwhile, the CDC has updated its variant information. BA.4,4.6, and 5 now account for 98% of all infections. BA.5 has slightly increased its share from 84.5% to 87%. BA.4.6 has not meaningfully increased its share:

It does not appear that BA.4 or BA.4.6 are going to make substantial inroads into BA.5’s dominance, although BA.4.6 makes up over 10% of infections in the High Plains (regional map not shown). BA.2.75 does not appear at all.
With no new variant ready to overtake BA.5, I continue to suspect in the immediate future there is further slow waning in cases, that will show up shortly in lower hospitalizations, and then lower deaths.
Finally, Trevor Bedford has a very informative thread about what endemic COVID is likely to look like, based on the rate of mutations and the period of time that previous infection makes a recovered person resistant to re-infection.
Here are a few highlights:
“Based on the experience in winter 2020/2021, seasonal influence on SARS-CoV-2 transmission is quite clear …
“we can gain some intuition from simple epidemiological models…
“In particular, we can use an SIRS system in which individuals go from Susceptible to Infected to Recovered, and then return to the Susceptible class due to immune waning / antigenic drift of the virus…
“ with flu-like ~5 year rate of waning (in blue), we get winter epidemics and summer troughs, while with faster waning we see greater levels of circulation and less variation between winter and summer (in yellow and red)…

“If what we’ve seen with Omicron evolution in 2022 becomes largely the norm, then this result would imply waning of ~24% in the span of ~6 months, or very roughly waning from R→S on a ~1.8 year time horizon, ie close to the yellow curve in the above SIRS model.”
He indicates he is not making a prediction, but rather to
“illustrate a scenario where we end up in a regime of year-round variant-driven circulation with more circulation in the winter than summer, but not flu-like winter seasons and summer troughs.”