Coronavirus dashboard for March 18: the BA.2 variant behaves just like original Omicron In the last several days, the 7 day average of cases in the US has increased slightly from 30,700 to 32,700. The rate of decline w/w has decelerated to only 10%. Meanwhile, deaths have finally declined to slightly below 1000 at 995. The number of jurisdictions where cases increased week over week has increased to 7 or so in the past several days, compare with 2 or 3 a week ago: All of this suggests that the decline from the BA.1 Omicron wave may be ending, at least temporarily. Like you, I have read in many places about the new BA.2 wave overtaking much of Europe, specifically including the UK, and warning that the same is in store for the US. The
Topics:
NewDealdemocrat considers the following as important: BA.2 variant, coronavirus dashboard, Healthcare, US/Global Economics
This could be interesting, too:
Bill Haskell writes Families Struggle Paying for Child Care While Working
Joel Eissenberg writes How Tesla makes money
Joel Eissenberg writes RFK Jr. blames the victims
Angry Bear writes True pricing: effects on competition
Coronavirus dashboard for March 18: the BA.2 variant behaves just like original Omicron
In the last several days, the 7 day average of cases in the US has increased slightly from 30,700 to 32,700. The rate of decline w/w has decelerated to only 10%. Meanwhile, deaths have finally declined to slightly below 1000 at 995. The number of jurisdictions where cases increased week over week has increased to 7 or so in the past several days, compare with 2 or 3 a week ago:
All of this suggests that the decline from the BA.1 Omicron wave may be ending, at least temporarily.
Like you, I have read in many places about the new BA.2 wave overtaking much of Europe, specifically including the UK, and warning that the same is in store for the US.
The truth appears to be more complicated.
I spent some time yesterday examining the work of Emma Hodcraft, Ph.D. of the Institute of Social and Preventive Medicine at the University of Bern, Switzerland, on whose data of infection prevalence by variant for many countries and for all jurisdictions in the US is found at Covariant.org. I’m going to discuss it in two parts. The first part is today, below.
The data she has collected demonstrate that BA.2 is very much an Omicron, rolling in and out like a tsunami. Like BA.1, the BA.2 variant causes peak infections by or very shortly after it approaches 100% of all infections.
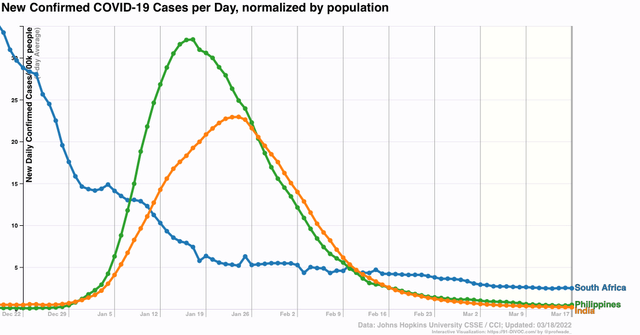
Here are graphs for South Africa, India, Denmark, and the Philippines, in all of which the BA.2 variant almost completely replaced BA.1 no later than the end of February (note: BA.1 is dark purple; BA.2 is light purple):
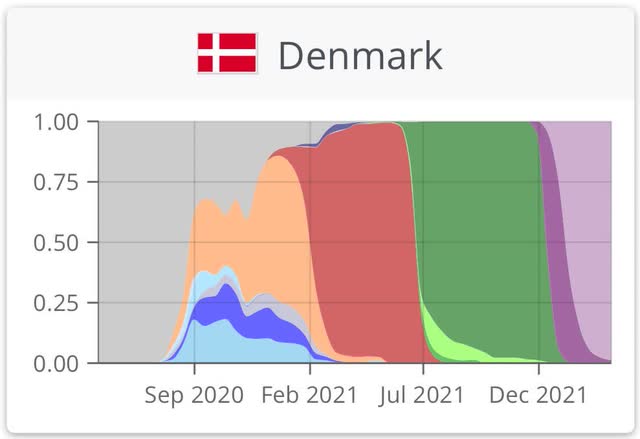
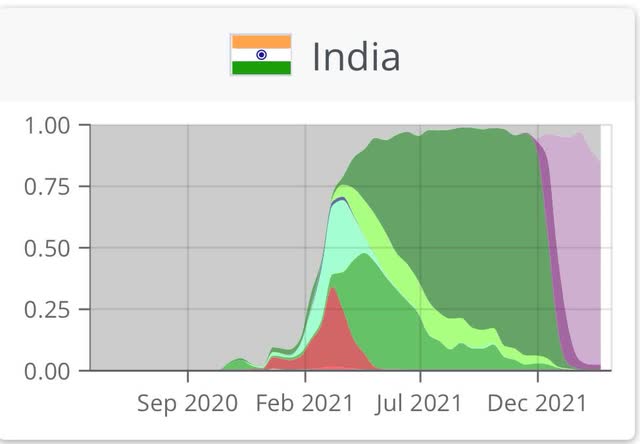
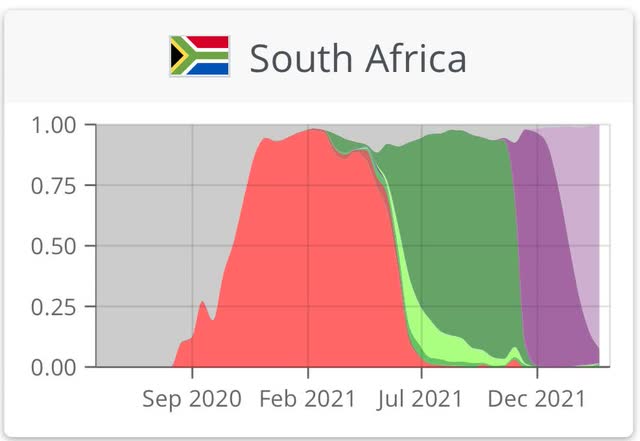
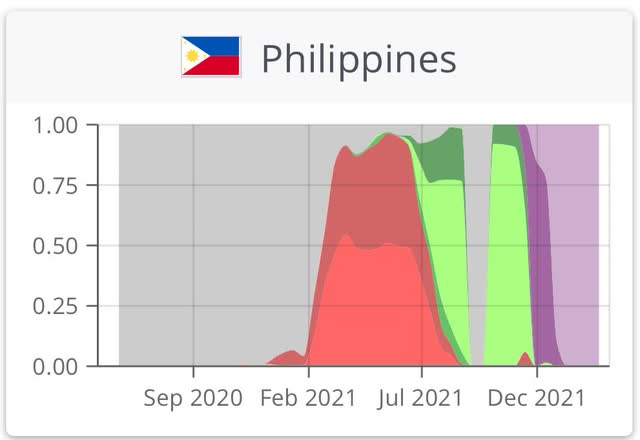
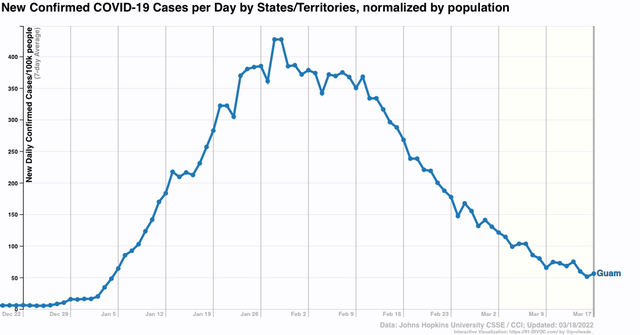
Similarly, here is her graph of the US territory of Guam in the Mariana Islands (the only US jurisdiction where BA.2 has completely supplanted BA.1):
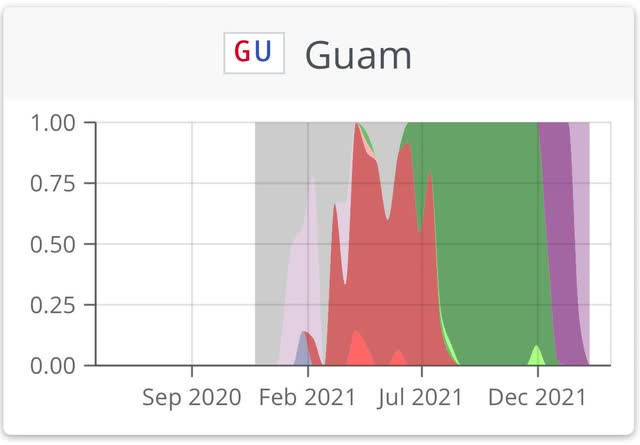
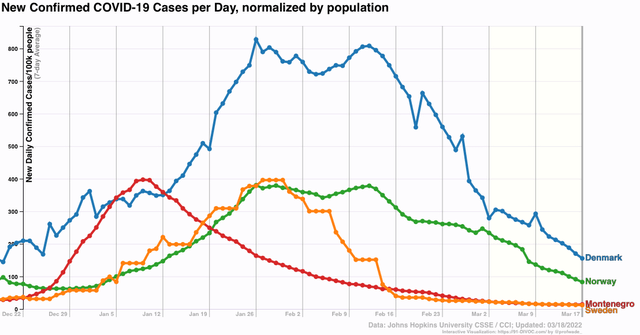
In every single case, infections peaked shortly before or after BA.2 reached close to 100% of infections. In fact, I examined data from 12 other countries where the BA.2 timeline is similar: Sweden, Norway, Singapore, Bangladesh, Sri Lanka, Cambodia, Hong Kong (yes, even Hong Kong, where BA.2 hit 90% penetration in mid-February. Cases peaked on March 4, and have fallen by 60% since then), Pakistan, Nepal, the Maldives, Montenegro, and Serbia; and each and everyone showed a peak of infections close in time, and almost all of them were down 75% or more from that peak, in some cases over 95% lower.
Here are several graphs showing infections from many of the countries discussed above:
And here is the same graph for Guam:
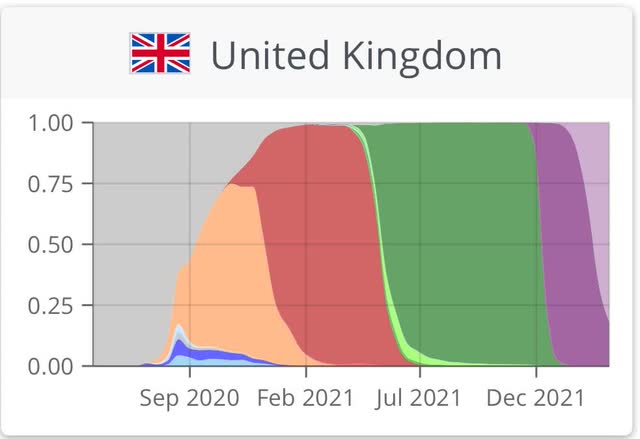
Now let’s turn to one of the present scary examples, the UK. According to the most recent UK government data I have seen, BA.2 accounts for 90% or more of all new COVID infections. It should be essentially 100% within about a week. Here is the relevant graph:
I found four other countries with similar trajectories: Switzerland, Vietnam, Jordan, and Monaco. In all of them, cases were rising just as in the UK, which is shown below:
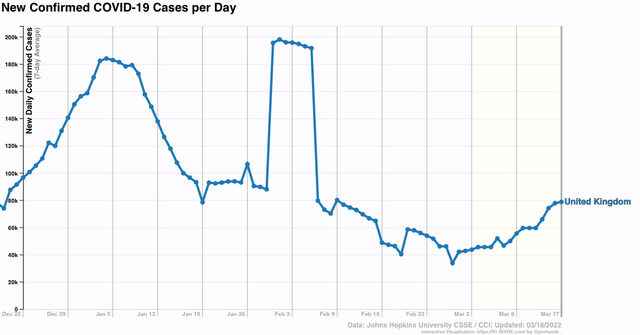
But in the past few days, the rate of increase in the UK week over week has declined from roughly 60% to 40%. If the UK follows the pattern of the close to 20 other countries I examined, then cases should peak in the UK within several weeks and, like original Omicron, decline sharply.
Why have other countries in Europe experienced second Omicron waves, and what does it mean for the US? That is what I will take a look at in the second post on this topic.
