Housing ends 2021 with a bang Housing ended 2021 with a bang, as housing starts (blue in the graph below, left scale) increased to 1.702 million annualized, and permits (gold) to 1.873 million annualized, in both cases the highest level since 2006 with the sole exception of last March / January, respectively. Single family permits (red, right scale), which are the least noisy, increased to 1.128 million annualized, the highest reading since May, but well below the 8 months previous to that: Because this is December data, even though it is seasonally adjusted, it may still be affected by Christmas seasonality, as exacerbated by the pandemic (right scale below). To some extent it may also be a reaction to the recent increase in mortgage rates
Topics:
NewDealdemocrat considers the following as important: Hot Topics, US/Global Economics
This could be interesting, too:
NewDealdemocrat writes JOLTS revisions from Yesterday’s Report
Joel Eissenberg writes No Invading Allies Act
Joel Eissenberg writes How Tesla makes money
NewDealdemocrat writes January JOLTS report: monthly increases, but significant downward revisions to 2024
Housing ends 2021 with a bang
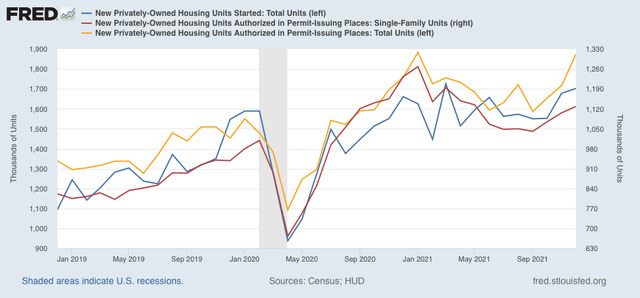
Housing ended 2021 with a bang, as housing starts (blue in the graph below, left scale) increased to 1.702 million annualized, and permits (gold) to 1.873 million annualized, in both cases the highest level since 2006 with the sole exception of last March / January, respectively. Single family permits (red, right scale), which are the least noisy, increased to 1.128 million annualized, the highest reading since May, but well below the 8 months previous to that:

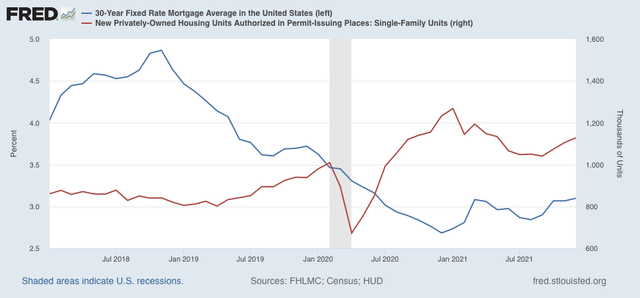
Because this is December data, even though it is seasonally adjusted, it may still be affected by Christmas seasonality, as exacerbated by the pandemic (right scale below). To some extent it may also be a reaction to the recent increase in mortgage rates (blue, left scale) off their bottom:

We have seen this dynamic before, where prospective homeowners, seeing an increase in mortgage rates and expecting more, “lock in” purchases before they become more expensive.
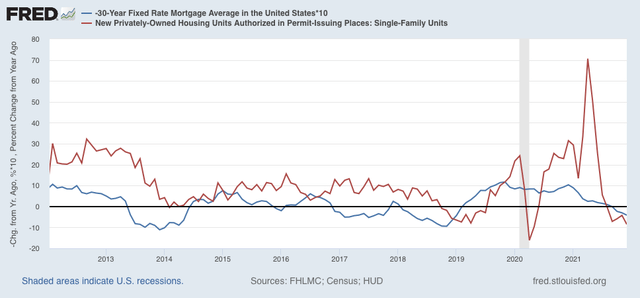
Below is the same data on mortgages and single family permits, but presented YoY:

This makes it easier to see that housing permits have historically followed mortgage rates (inverted), with a 3 to 6 month lag. Mortgage rates have turned higher than they were 1 year ago, and permits have turned lower than one year ago.
According to Mortgage News Daily, mortgage rates yesterday averaged 3.7%, the highest in over a year. Should these higher rates continue, we can expect a significant decline in new housing permits and starts in the next few months.
In the meantime, because housing permits and starts are an important component of the long leading indicators, this data will play an important role in my long term forecast, which will be determined after data for Q4 GDP is reported next week.
