Housing unaffordability closes in on bubble peaks; expect substantial price declines and increased foreclosures in the likely oncoming recession – by New Deal democrat I last looked at the issue of housing affordability at the beginning of April. As we all know, mortgage rates have continued to skyrocket in the past several months. At present they are just under 6.10%: This has changed the calculus on housing affordability considerably. So let’s take a look. In April house prices in real terms were already almost identical to their 2006 highs. Depending on what house price index you use, nominally prices are up somewhere on the order of 60% since then. For example, here is a graph of new home prices and the FHFA index for the 2000s: And
Topics:
NewDealdemocrat considers the following as important: Hot Topics, housing unaffordability, US EConomics, US/Global Economics
This could be interesting, too:
NewDealdemocrat writes JOLTS revisions from Yesterday’s Report
Joel Eissenberg writes No Invading Allies Act
Bill Haskell writes The North American Automobile Industry Waits for Trump and the Gov. to Act
Bill Haskell writes Families Struggle Paying for Child Care While Working
Housing unaffordability closes in on bubble peaks; expect substantial price declines and increased foreclosures in the likely oncoming recession
– by New Deal democrat
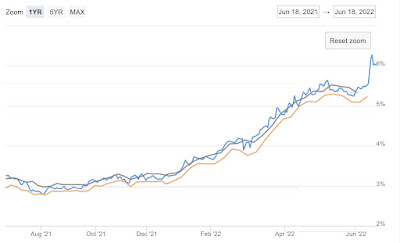
I last looked at the issue of housing affordability at the beginning of April. As we all know, mortgage rates have continued to skyrocket in the past several months. At present they are just under 6.10%:

This has changed the calculus on housing affordability considerably. So let’s take a look.
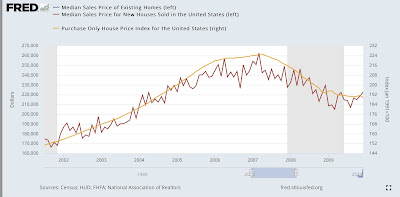
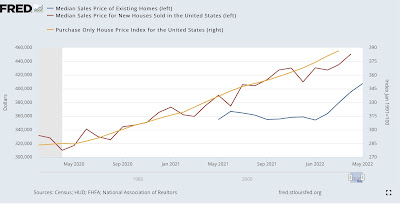
In April house prices in real terms were already almost identical to their 2006 highs. Depending on what house price index you use, nominally prices are up somewhere on the order of 60% since then. For example, here is a graph of new home prices and the FHFA index for the 2000s:

And here is the past several years:

Meanwhile, the median price for an existing home peaked in July 2006 at $230,200. As we saw yesterday, as of last month they were $402,000.
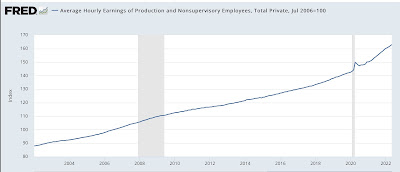
Average hourly wages for non-supervisory workers are also up a little over 60% since 2006:

Since in real, wage-adjusted terms, house prices are about the same now as they were at the peak of the housing bubble, let’s compare an identical mortgage then and now as well, for simplicity’s sake using $250,000, at the prevailing mortgage rates. Here’s the monthly payment for each:
April 2006: $1865.
July 2006: $1913.
April 2022: $1583.
June 2022: $1798.
The bottom line is that the average monthly mortgage payment has increased by about 13.6% in the past two months, and now is about 96% in real, wage-adjusted terms, of what it was at the peak of the bubble.
Even before yesterday’s report, the NAR’s “Housing Affordability Index” had dropped to 105 in April. How low is that? Well, for comparison here’s what the Affordability Index was during the 2000s:

At the worst of the housing bubble, it sat right at 100.
In short, housing is equal to its worst affordability levels in the past 35 years.
Frankly, I have been very surprised at this, since mortgage lenders are being much more careful now than they were at the peak of the bubble when anything that fogged the mirror could get a loan.
This changes the calculus of the housing market – and the economy – going forward significantly.
While I don’t see the banking system fallout that we had in 2008, when all the birds came home to roost on those ridiculous loans, creating a cascade of financial system defaults, I *do* now see it as being almost inevitable that there will be another significant decline in house prices that will last a number of years. This will trap a large number of younger homeowners in houses that are financially “underwater,” as they make payments on a house they can’t sell for the price at which they bought. And an increase in unemployment during a recession next year that looks increasingly inevitable will mean a substantial increase in foreclosures for some of these buyers as well.
Not so good.
