Two long leading indicators – real money supply and credit conditions – worsen – by New Deal democrat ~~~~~~~ M1 and M2 money supply for May was reported yesterday by the Fed. The former was unchanged for the month, and the latter was up a tiny 0.1%: That is significant. Why? Because real money supply is a long leading indicator. Real M2 fell out of favor after failing to actually decline YoY prior to the 2001 and 2008 recessions, but a YoY% decline in real M1 and a real YoY% gain of M2 of less than 2.5% is nevertheless an excellent leading indicator for recession: Here is a close-up on the past year: Both real M1 and real M2 are outright negative as of May. There have been several false positives for this indicator: 1967, 1987,
Topics:
NewDealdemocrat considers the following as important: Chicago Fed, Credit, M1, M2, New Deal Democrat, US EConomics
This could be interesting, too:
NewDealdemocrat writes JOLTS revisions from Yesterday’s Report
Bill Haskell writes The North American Automobile Industry Waits for Trump and the Gov. to Act
Bill Haskell writes Families Struggle Paying for Child Care While Working
Joel Eissenberg writes Time for Senate Dems to stand up against Trump/Musk
Two long leading indicators – real money supply and credit conditions – worsen
– by New Deal democrat
~~~~~~~
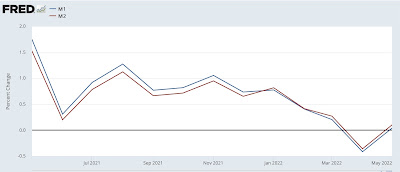
M1 and M2 money supply for May was reported yesterday by the Fed. The former was unchanged for the month, and the latter was up a tiny 0.1%:

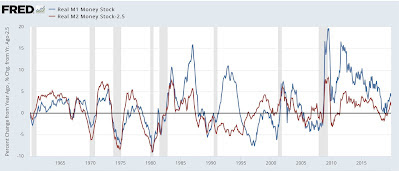
That is significant. Why? Because real money supply is a long leading indicator. Real M2 fell out of favor after failing to actually decline YoY prior to the 2001 and 2008 recessions, but a YoY% decline in real M1 and a real YoY% gain of M2 of less than 2.5% is nevertheless an excellent leading indicator for recession:

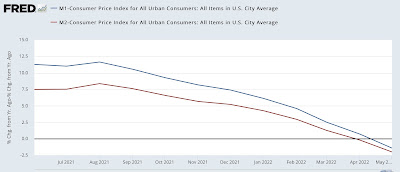
Here is a close-up on the past year:

Both real M1 and real M2 are outright negative as of May.
There have been several false positives for this indicator: 1967, 1987, and 1994. But otherwise, every time this has happened, a recession has followed within 9 months to 2 years.
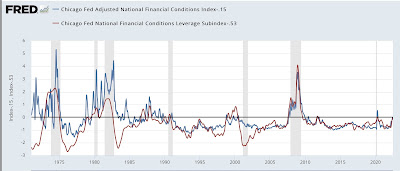
Additionally, the Chicago Fed updated its financial conditions indexes this morning. The Adjusted National Conditions Index rose to +.15, and the Leverage Index rose to +.53. With the exceptions of 1987 and 2011, both of these are at levels typically associated with oncoming recessions:

In sum, the long leading indicators continue to worsen. The only unambiguously positive such indicator at the moment is the Treasury yield curve (and even there, the 10 year minus 2 year spread is *almost* – but not quite – inverted).
