– by New Deal democrat I call industrial production the King of Coincident Indicators, because more often than any other metric it coincides with the peaks and troughs of economic activity as determined by the NBER, the official arbiter of recessions. Unlike retail sales, the news this morning for October was not so good. While manufacturing production did increase +0.2% to a new post-pandemic high, overall production declined -0.1% for the month. Also, July and August’s production numbers were revised down -0.1% each, and September’s strong number was revised down -0.4% to only +0.1%. As a result, total production has gone nowhere in the three months since July: This sideways trend in total production is frequently observed before
Topics:
NewDealdemocrat considers the following as important: Fed Chair Powell, Hot Topics, King of Coincident Indicators, politics, recessions, US EConomics
This could be interesting, too:
Robert Skidelsky writes Lord Skidelsky to ask His Majesty’s Government what is their policy with regard to the Ukraine war following the new policy of the government of the United States of America.
NewDealdemocrat writes JOLTS revisions from Yesterday’s Report
Joel Eissenberg writes No Invading Allies Act
Ken Melvin writes A Developed Taste
– by New Deal democrat
I call industrial production the King of Coincident Indicators, because more often than any other metric it coincides with the peaks and troughs of economic activity as determined by the NBER, the official arbiter of recessions.
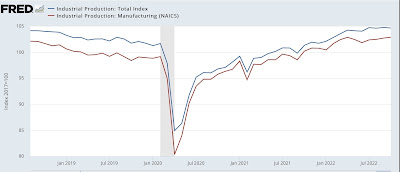
Unlike retail sales, the news this morning for October was not so good. While manufacturing production did increase +0.2% to a new post-pandemic high, overall production declined -0.1% for the month. Also, July and August’s production numbers were revised down -0.1% each, and September’s strong number was revised down -0.4% to only +0.1%. As a result, total production has gone nowhere in the three months since July:

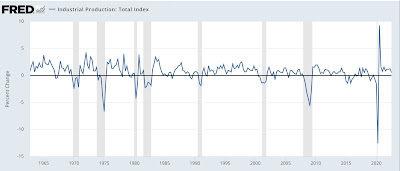
This sideways trend in total production is frequently observed before recessions, but it also coincides with slowdowns during expansions (see, e.g., 2018-19), so is not particularly dispositive of anything. Unfortunately FRED does not have a tool for creating 3 month moving averages (the one big shortfall of that site imo), but I can approximate showing you this via a graph of the quarter over quarter change for the past 60 years ending with the July-September quarter:

Note, for example, the negative q/q reads during the 1966 and 2016 slowdowns.
This is a report consistent with a very slowly expanding economy, but one that is not yet in recession.
“Strong September Industrial Production,” Angry Bear, angry bear blog
