Strong personal income and spending contrast with near record low in saving – by New Deal democrat Like retail sales earlier in November, personal income and spending both rose smartly, as shown in the below graph of real retail sales compared with real personal spending: Real personal income was up 0.4%, and real personal spending increased 0.5%: Nominally each increased 0.3% more; i.e., the PCE deflator was 0.3%. Each metric only had one better reading in the entire past year. Since the spring 2021 stimulus ended, personal spending is up 3.9%. Personal income remains down -1.9%, although it has improved in the past few months (thank you, big decline in gas prices!): With real income still down, you may wonder where all the fuel
Topics:
NewDealdemocrat considers the following as important: Income and spending, New Deal Democrat, savings, US EConomics
This could be interesting, too:
NewDealdemocrat writes JOLTS revisions from Yesterday’s Report
Bill Haskell writes The North American Automobile Industry Waits for Trump and the Gov. to Act
Bill Haskell writes Families Struggle Paying for Child Care While Working
Joel Eissenberg writes Time for Senate Dems to stand up against Trump/Musk
Strong personal income and spending contrast with near record low in saving
– by New Deal democrat
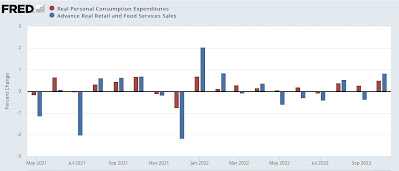
Like retail sales earlier in November, personal income and spending both rose smartly, as shown in the below graph of real retail sales compared with real personal spending:

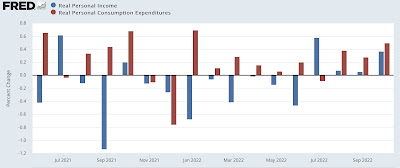
Real personal income was up 0.4%, and real personal spending increased 0.5%:

Nominally each increased 0.3% more; i.e., the PCE deflator was 0.3%. Each metric only had one better reading in the entire past year.
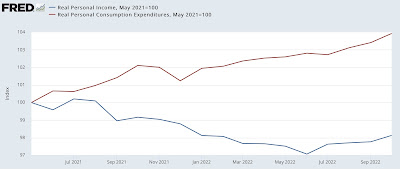
Since the spring 2021 stimulus ended, personal spending is up 3.9%. Personal income remains down -1.9%, although it has improved in the past few months (thank you, big decline in gas prices!):

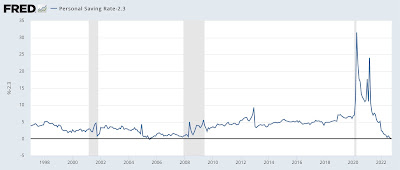
With real income still down, you may wonder where all the fuel for increased spending has been coming from. The answer is a continuing decline in the saving rate, which at 2.3% for October, was the lowest in the entire 60+ year history of the series, except of one month (July 2005), as shown in the below graph which subtracts -2.3% so that the current level shows as zero:

In short, both sales and spending – two sides of the same coin – were strong in October, assisted in part by the continuing decline in gas prices. But with near-record low savings, consumers are more vulnerable to a negative shock than they have ever been.
