House price indexes decline, unchanged in October; further evidence of real declines since summer The Case Shiller national house price index declined another -0.3% in November, and is now up 9.2% YoY, compared with a peak of +20.8% YoY in March (note that is in line with my rule of thumb that a decline of 1/2 or more in YoY growth over the past 12 months indicates a series has peaked and rolled over). The FHFA purchase only house price index was unchanged for the month, and is up 9.7% YoY (vs. its peak of +19.7% in February, so also is in decline per my rule of thumb): Here’s an update of the FHFA house price index YoY (/2 for scale) vs. Owners’ Equivalent Rent in the CPI: Because OER follows house prices with roughly a 12 month lag, I
Topics:
NewDealdemocrat considers the following as important: House prices, politics, US EConomics, US/Global Economics
This could be interesting, too:
Robert Skidelsky writes Lord Skidelsky to ask His Majesty’s Government what is their policy with regard to the Ukraine war following the new policy of the government of the United States of America.
NewDealdemocrat writes JOLTS revisions from Yesterday’s Report
Joel Eissenberg writes No Invading Allies Act
Ken Melvin writes A Developed Taste
House price indexes decline, unchanged in October; further evidence of real declines since summer
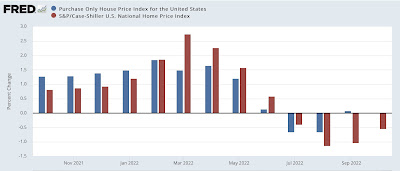
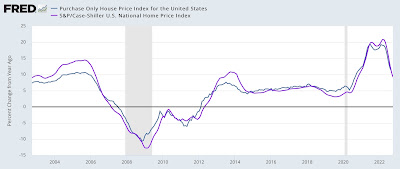
The Case Shiller national house price index declined another -0.3% in November, and is now up 9.2% YoY, compared with a peak of +20.8% YoY in March (note that is in line with my rule of thumb that a decline of 1/2 or more in YoY growth over the past 12 months indicates a series has peaked and rolled over).

The FHFA purchase only house price index was unchanged for the month, and is up 9.7% YoY (vs. its peak of +19.7% in February, so also is in decline per my rule of thumb):

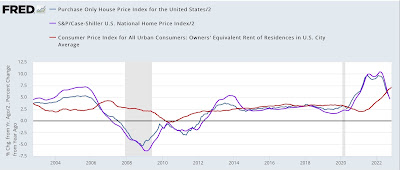
Here’s an update of the FHFA house price index YoY (/2 for scale) vs. Owners’ Equivalent Rent in the CPI:

Because OER follows house prices with roughly a 12 month lag, I expect OER to continue to increase YoY for a few more months before declining steeply probably beginning next spring. Note also that the most recent FHFA and Case Shiller report is for Octobe,, so this month’s YoY change is probably closer to about 6%.
“November housing permits and starts: the biggest news is not even a headline, Angry Bear, angry bear blog”
