Real personal income and spending hold up (thank you, lower gas prices!) but still consistent with onset of recession This morning’s report on personal income and spending for November shows why I pay more attention to real retail sales as a forecasting tool. First, to the data: personal income increased nominally by 0.3% in November, while nominal spending increased only 0.1%. Since the deflator for the month was 0.1%, that means real income increased 0.3% and real spending was unchanged. Since the end of stimulus spending in May 2021, real spending is up 4.1%, while real income has declined -1.7%: The personal saving rate increased 0.2% to 2.4%, which is just above its all time lows, as shown in the below graph which subtracts -2.4% so that
Topics:
NewDealdemocrat considers the following as important: real personal income, spending and saving, US EConomics
This could be interesting, too:
NewDealdemocrat writes JOLTS revisions from Yesterday’s Report
Bill Haskell writes The North American Automobile Industry Waits for Trump and the Gov. to Act
Bill Haskell writes Families Struggle Paying for Child Care While Working
Joel Eissenberg writes Time for Senate Dems to stand up against Trump/Musk
Real personal income and spending hold up (thank you, lower gas prices!) but still consistent with onset of recession
This morning’s report on personal income and spending for November shows why I pay more attention to real retail sales as a forecasting tool.
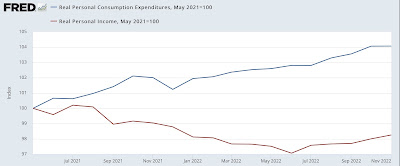
First, to the data: personal income increased nominally by 0.3% in November, while nominal spending increased only 0.1%. Since the deflator for the month was 0.1%, that means real income increased 0.3% and real spending was unchanged. Since the end of stimulus spending in May 2021, real spending is up 4.1%, while real income has declined -1.7%:
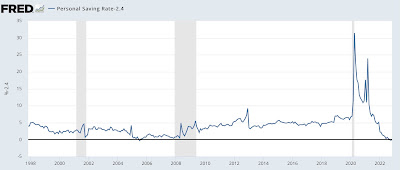
The personal saving rate increased 0.2% to 2.4%, which is just above its all time lows, as shown in the below graph which subtracts -2.4% so that the current reading shows as 0:
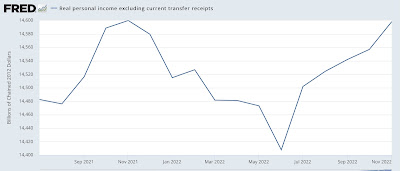
Real personal income less transfer receipts is one of the 4 monthly data series heavily relied upon by the NBER in dating recessions. This increased in November and is less than -0.1% below its all time high of exactly one year ago. The big decline in gas prices since June is a major driver of the recent improvement:
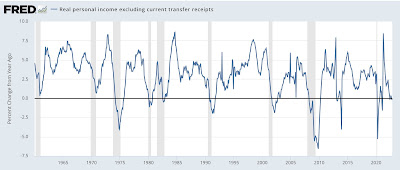
Which means that the YoY reading is just below 0. Why is this significant? Because in the past this metric has only declined to 0 or negative during – frequently late in – recessions:
This lag in the performance of real income and spending is why I pay more attention to real retail sales. Here is the 50+ year look at the YoY% changes in real personal spending (blue) vs. real retail sales (red):
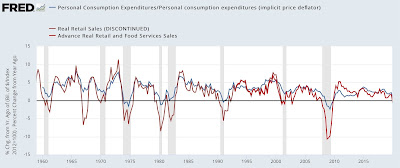
Note that real retail sales have *always* turned negative YoY before recessions start, whereas real personal spending either turns late, and sometimes does not turn negative at all.
Here is what that looks like for the past 12 months:
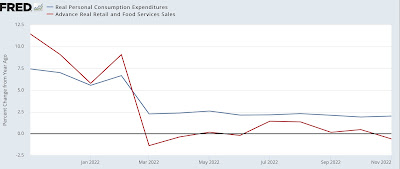
Real retail sales have been flat to slightly negative ever since this past March with the exception of July and August, while real spending is still higher by 2.0% – although in the past such a low positive level has also been consistent with the onset of a recession.
At the moment, the labor market is the only segment of the economy that does not appear to be actively rolling over into recession.
“Real personal income and spending both decline in December,” Angry Bear, angry bear blog
