The worst interest rate upturn since 1994 is likely to produce the worst housing downturn in over a decade No economic news of note today; but tomorrow we will see housing permits and starts for March, and on Wednesday existing home sales. So let’s take an important look at housing. The recent increase in mortgage rates to over 5% is the most serious interest rate threat to housing in at least the past 30 years. As the below graph shows, the increase in over 2% is the biggest jump in mortgages since 1994: But additionally, in 1994, when interest rates jumped from 6.75% to 9.25%, that was a 37% increase in monthly mortgage costs. The jump in the past year from 2.65% to 5.00% makes for an 89% increase in monthly costs. In other words, in
Topics:
NewDealdemocrat considers the following as important: Interest rates, recession, US EConomics
This could be interesting, too:
NewDealdemocrat writes JOLTS revisions from Yesterday’s Report
Bill Haskell writes The North American Automobile Industry Waits for Trump and the Gov. to Act
Bill Haskell writes Families Struggle Paying for Child Care While Working
Joel Eissenberg writes Time for Senate Dems to stand up against Trump/Musk
The worst interest rate upturn since 1994 is likely to produce the worst housing downturn in over a decade
No economic news of note today; but tomorrow we will see housing permits and starts for March, and on Wednesday existing home sales. So let’s take an important look at housing.
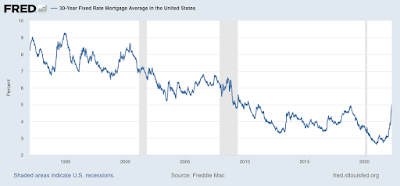
The recent increase in mortgage rates to over 5% is the most serious interest rate threat to housing in at least the past 30 years. As the below graph shows, the increase in over 2% is the biggest jump in mortgages since 1994:

But additionally, in 1994, when interest rates jumped from 6.75% to 9.25%, that was a 37% increase in monthly mortgage costs. The jump in the past year from 2.65% to 5.00% makes for an 89% increase in monthly costs. In other words, in 1994 a $1000/month interest payment jumped to $1370; in the past year a $1000 payment would jump to $1890!
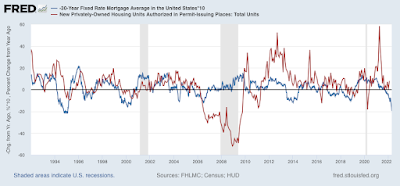
And housing is very responsive to mortgage payments. Here’s a graph I have run many times before: the YoY change in mortgage rates (inverted, so that an increase in rates shows as a decrease; and *10 for scale), compared with the YoY% change in housing permits. Typically, I only run this graph for the last 10 years; this time I’m taking it all the way back to before 1994:

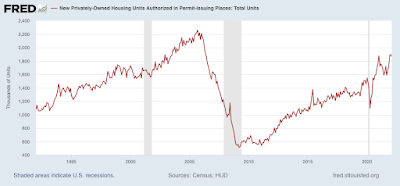
The YoY change in mortgage interest rates now has only been matched by the 1994 change. In response, in 1995 housing permits were down -10% YoY, and 15% from peak to trough, as shown in the graph below of permits for the last 30 years:

The question, of course, is a 10% YoY decline from where. From the recent 1.9M high, the 1.6M low last summer, or somewhere in between? If the decline is 15%, as in 1994, that would take us back down to 1.7M permits.
And I do expect a downturn. In 2013-14, there was less of a downturn than would be typically expected, partly because of pent-up demand from the Housing Bust, and partly due to the demographic tailwind of the Millennial generation reaching home-buying age. Neither of those buffers exist any more.
Because of the effect on monthly interest payments, as discussed above, I suspect it will be worse. And that would almost certainly have enough impact on the economy next year to put us close to if not in a recession, all by itself.
