The bifurcation in the new vs. existing home market continues – by New Deal democrat Last week we saw that sales of existing homes plummeted to a 28 year low, save for one month in 2010; but prices for the very limited number of such homes on the market rose 2.8% YoY. This morning we saw the exact converse happen with new home sales, which rose to a 12 month high of 759,000 annualized, up 83,000 from one month ago; while prices declined ,300 month over month to 3,800, very close to a 2 year low: In short, the compete bifurcation of the new vs. existing home markets continues. Unlike existing homeowners, many of whom are shackled in place by 3% mortgages, new home builders can offer price incentives and downsize floor plans to
Topics:
NewDealdemocrat considers the following as important: Hot Topics, housing, New, New Deal Democrat, OCT 2023, Old, US EConomics
This could be interesting, too:
NewDealdemocrat writes JOLTS revisions from Yesterday’s Report
Joel Eissenberg writes No Invading Allies Act
Bill Haskell writes The North American Automobile Industry Waits for Trump and the Gov. to Act
Bill Haskell writes Families Struggle Paying for Child Care While Working
The bifurcation in the new vs. existing home market continues
– by New Deal democrat
Last week we saw that sales of existing homes plummeted to a 28 year low, save for one month in 2010; but prices for the very limited number of such homes on the market rose 2.8% YoY.
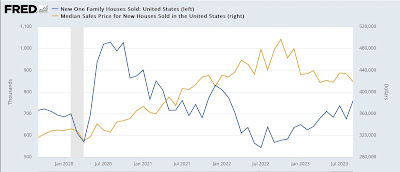
This morning we saw the exact converse happen with new home sales, which rose to a 12 month high of 759,000 annualized, up 83,000 from one month ago; while prices declined $14,300 month over month to $413,800, very close to a 2 year low:

In short, the compete bifurcation of the new vs. existing home markets continues. Unlike existing homeowners, many of whom are shackled in place by 3% mortgages, new home builders can offer price incentives and downsize floor plans to increase sales.
Which is an interesting twist on my basic housing mantra, which is that interest rates lead sales, which in turn lead prices. Let’s update each metric.
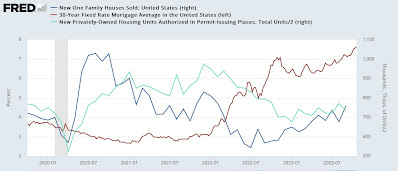
First, here are mortgage rates (red) vs. new home sales (blue) and permits (light blue):

As mortgage rates rose sharply in 2022, permits and sales sank. Mortgage rates moderated throughout most of 2023 so far, and both sales and permits have responded positively.
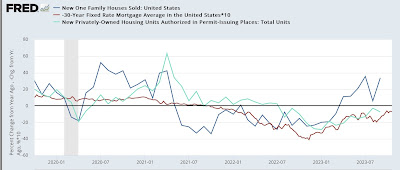
Here’s the same data captured as YoY% changes, so that it is easier to see that both sales and permits followed the changes in mortgage rates, which are /10 for scale, and inverted better to show the relationship:

As I always caution, new home sales, while the most leading housing metric of all – usually the first to turn – are also very volatile, and sharply revised. So with the increase in mortgage rates to new 20 year highs, I fully expect both sales and permits to reverse lower in the next few months.
Meanwhile, as indicated in the first graph above, prices continued to increase, even as sales declined, until last October. Sales bottomed in July 2022, but prices have generally continued to decline, and may be bottoming now.
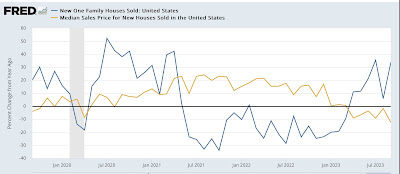
Here is the same data YoY:

While sales are up 33.9% compared with one year ago, prices are down -12.3%.
New and existing home sales combined are down in the aggregate since one year ago, and so are prices. Since mortgage rates will put more pressure on sales, I expect prices to continue to moderate (if that’s an appropriate word, considering overall un-affordability) in the months to come.
House prices stabilize (or even increase!) for existing homes, while prices have been slashed for new homes. What’s going on? Angry Bear, New Deal democrat
