This was posted at 8:03 AM at the Bonddad Blog Thursday. I see other venues having similar reports up also. I am sometimes late in posting NDd’s economic commentaries. Ex-housing, PCE inflation, like CPI inflation, is under the Fed’s 2% target – by New Deal democrat Note: I may not be around for the ISM manufacturing or construction spending reports this morning. If so, I’ll comment later (maybe over the weekend) about them. What I’ll be watching for: as to manufacturing, because the ISM is a diffusion index, it didn’t pick up the big increase in vehicle manufacturing earlier this year. How does that shake out for October (bearing in mind the UAW strilke)? As to construction spending, which typically trends in conjunction with building units
Topics:
NewDealdemocrat considers the following as important: Hot Topics, PCE Inflaion, US EConomics
This could be interesting, too:
NewDealdemocrat writes JOLTS revisions from Yesterday’s Report
Joel Eissenberg writes No Invading Allies Act
Bill Haskell writes The North American Automobile Industry Waits for Trump and the Gov. to Act
Bill Haskell writes Families Struggle Paying for Child Care While Working
This was posted at 8:03 AM at the Bonddad Blog Thursday. I see other venues having similar reports up also. I am sometimes late in posting NDd’s economic commentaries.
Ex-housing, PCE inflation, like CPI inflation, is under the Fed’s 2% target
– by New Deal democrat
Note: I may not be around for the ISM manufacturing or construction spending reports this morning. If so, I’ll comment later (maybe over the weekend) about them. What I’ll be watching for: as to manufacturing, because the ISM is a diffusion index, it didn’t pick up the big increase in vehicle manufacturing earlier this year. How does that shake out for October (bearing in mind the UAW strilke)? As to construction spending, which typically trends in conjunction with building units under construction, does it hold up, or turn down (signaling a decline in housing construction)?
One thing I didn’t comment on with regard to yesterday’s personal income and spending report was inflation. So let’s take a look today. Spoiler alert: it generally mirrors the CPI report.
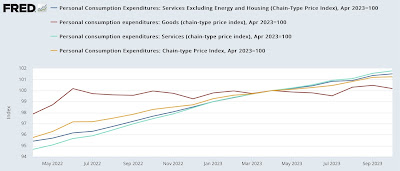
To begin with, PCE inflation for over a year has been all about services. Since June of last year, there has been *no* inflation in goods prices (red in the graph below). In the past 6 months, while total PCE inflation (gold) has been 1.2%, goods inflation has been a whopping 0.2%. Services inflation (light blue) has been 1.8% (or 3.7% annualized). Backing out housing and energy, services inflation (dark blue) is up 1.5% (or 3.0% annualized):
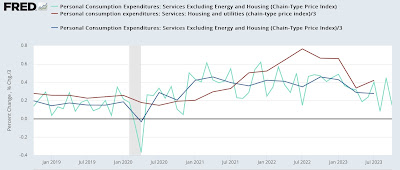
Another way to look at this is the month over month (light blue) or quarter over quarter (dark blue) changes in the PCE index excluding energy and housing, vs. the quarter over quarter changes in housing plus utilities (red):
In Q3, the former was up 0.8%, while the latter increased 1.3%. In October, the former increased less than 0.2%.
As with CPI inflation, it’s clear that housing is the culprit.
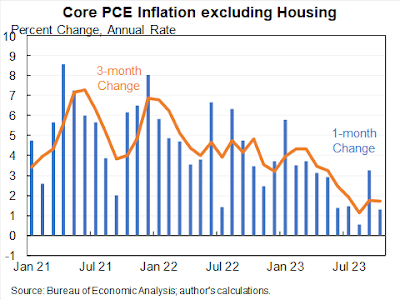
Harvard economist Jason Furman posted a couple of similar graphs yesterday, showing the monthly and 3 month average of the core PCE price index ex-housing:
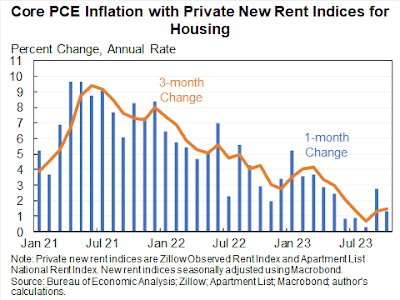
And including housing, but substituting current rent increases for the official measure:
As he writes, core ex-housing is up only 1.7% YoY, and substituting current rents for the official measure of housing is up only 1.5%.
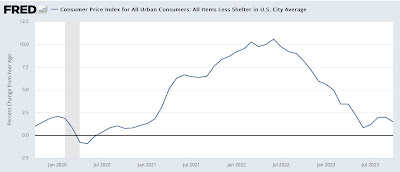
Just as a refresher, this is exactly what CPI ex-shelter looks like:
To be absolutely clear: the PCE inflation gauges, just like the CPI measures, show that excluding housing, inflation is already under the Fed’s 2% target. And if we include more current rent and house price measures, it is even a little lower than that.
Please do note that in the past few months, both PCE ex-shelter and CPI ex-shelter have bottomed. They aren’t really increasing, but they’ve stopped decreasing. But – I know I’ve said this before – there really is no valid reason for the Fed to maintain a restrictive posture on interest rates. Indeed, if the Fed lowered rates a little, and mortgage rates declined to, say 5.5%, that might break the logjam in the existing home market, and via more inventory paradoxically help keep prices down.
Driven by frozen inventory, repeat home prices continue to increase, but downward pressure on shelter inflation remains, Angry Bear, New Deal democrat.

