Existing home sales and prices decline; plus, a closer look at multi-unit housing construction – by New Deal democrat I will keep my comments on December existing home sales and prices brief. That’s because, even though they make up about 90% of the total market, they have much less economic impact than new home construction. They are best used to confirm trends; in this case, that housing sales have continued to decline, and prices (which follow sales with a lag) have also rolled over. And confirm both trends they did. December sales declined another -1.5% to 4.02 million annualized, a -34% YoY decline. Via Mortgage News Daily, here’s what they looked like for the last 3 years through November: The median price of an existing home,
Topics:
NewDealdemocrat considers the following as important: Hot Topics, US EConomics, US/Global Economics
This could be interesting, too:
NewDealdemocrat writes JOLTS revisions from Yesterday’s Report
Joel Eissenberg writes No Invading Allies Act
Bill Haskell writes The North American Automobile Industry Waits for Trump and the Gov. to Act
Bill Haskell writes Families Struggle Paying for Child Care While Working
Existing home sales and prices decline; plus, a closer look at multi-unit housing construction
– by New Deal democrat
I will keep my comments on December existing home sales and prices brief. That’s because, even though they make up about 90% of the total market, they have much less economic impact than new home construction. They are best used to confirm trends; in this case, that housing sales have continued to decline, and prices (which follow sales with a lag) have also rolled over.
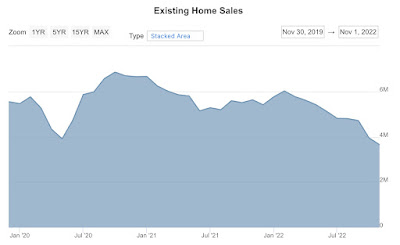
And confirm both trends they did. December sales declined another -1.5% to 4.02 million annualized, a -34% YoY decline. Via Mortgage News Daily, here’s what they looked like for the last 3 years through November:
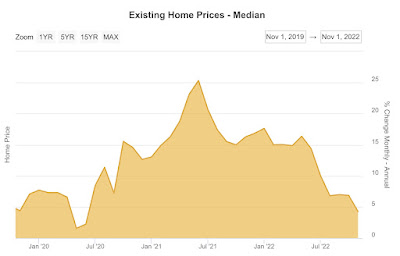
The median price of an existing home, which isn’t seasonally adjusted, declined further to $366,900, only a 2.3% YoY increase from 2021’s $358,800. My rule of thumb for non-seasonally adjusted data is that the trend has turned when the YoY increase is less than 1/2 of its maximum increase in the past 12 months. That was January 2022’s +17.1%. Needless to say, only a 2.3% YoY increase in December confirms that prices have turned down. Here’s what YoY prices also look like for the past 3 years through November:
With that out of the way, I wanted to follow up a little on yesterday’s post about housing construction, since I read a piece that pointed out that the remaining strength in the market is multi-family construction.
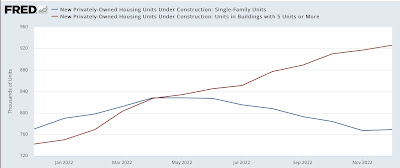
Indeed, that is the case. Single family housing under construction peaked at 828,000 units annualized in April, and is down -7% since then, while multi-unit construction has continued to increase since that time from 827,000 units annualized to 926,000, a 12% increase:
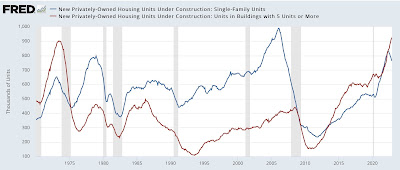
This is not unusual. A long term look indicates that with the exception of the 1980s, multi-unit construction has always peaked later than single family construction:
This is generally because apartment and condominium living is typically a less expensive alternative to buying a single family home. When prices get steep enough, young buyers in particular find that apartments or condos are their only affordable option.
Still, with the exception of the pandemic, and at the tail end of the 2000s housing bubble, even multi-unit construction has turned down in advance of recessions. The latest occasions (outside of 2007, when there was a -3% decrease followed by a 6% increase up until the recession began) were in 1973 and 1981. Multi-unit construction peaked 4 months before the onset of the recessions, and declined -3% and -7% respectively. Most often, multi unit construction peaked no later than 4 months after single family construction, although in the case of the housing bubble, it took over 2 years!
Since the YoY% pace of multi-unit construction growth has only slowed from 27% in August to 24.8% in December, it appears we are at least a few months away from this sector rolling over.
Edited to Add: In the past, multi-unit housings under construction has generally peaked 1-5 months after the 3 month average of multi-unit starts has peaked. The below graph shows such starts both monthly (which are very noisy, blue) and quarterly (gold) to best show this:
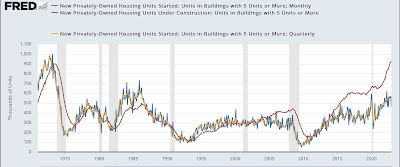
The 3 month average of multi-unit starts appears to have just peaked in Sep-Nov, so it is likely that multi-unit construction turns down by April.
Housing; permits and starts falling, under construction continues slow rise, Angry Bear, angry bear blog
