House resale price indexes confirm upturn in prices for existing homes, but do not negate combined price declines – by New Deal democrat We got more price information about the very important housing market this morning. Through September, the median price of home resales as measured by Case Shiller increased 0.9% monthly. For the FHFA Index they rose 0.6%. Both measures are up about 46% since just before the pandemic hit (note: FRED hasn’t updated the FHFA index yet): On a YoY basis, prices have rebounded in both indexes, 5.6% for the FHFA and 2.6% in the Case Shiller National index. Since historically the FHFA has tended to slightly lead the Case Shiller index, unsurprisingly the upturn in the former index is now showing up in the
Topics:
NewDealdemocrat considers the following as important: Hot Topics, Housing Resale, indexes, November 2023, US EConomics
This could be interesting, too:
NewDealdemocrat writes JOLTS revisions from Yesterday’s Report
Joel Eissenberg writes No Invading Allies Act
Bill Haskell writes The North American Automobile Industry Waits for Trump and the Gov. to Act
Bill Haskell writes Families Struggle Paying for Child Care While Working
House resale price indexes confirm upturn in prices for existing homes, but do not negate combined price declines
– by New Deal democrat
We got more price information about the very important housing market this morning.
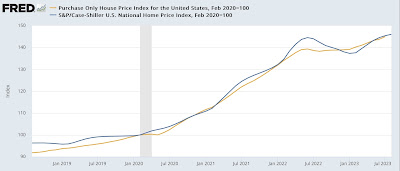
Through September, the median price of home resales as measured by Case Shiller increased 0.9% monthly. For the FHFA Index they rose 0.6%. Both measures are up about 46% since just before the pandemic hit (note: FRED hasn’t updated the FHFA index yet):

On a YoY basis, prices have rebounded in both indexes, 5.6% for the FHFA and 2.6% in the Case Shiller National index. Since historically the FHFA has tended to slightly lead the Case Shiller index, unsurprisingly the upturn in the former index is now showing up in the latter:

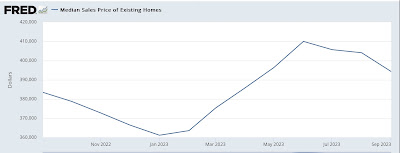
Because both these indexes measure resales of the same unit, by definition they are existing home sales. For comparison, here is the last 12 months, not seasonally adjusted, of the median price of existing homes:

YoY they are up 2.8%, right in line with the Case Shiller outcome.
So, are price declines in the overall housing market over? No!
Remember that this housing market has been severely bifurcated, due to most existing homeowners being frozen in place by their existing 3% mortgages, so buyers have flocked to new homes (and especially new condos and apartments), where volume is at or near all-time highs, prices have come down substantially, and builders are offering mortgage subsidies for the first several years of ownership.
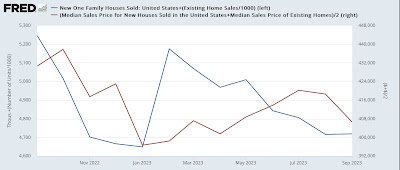
To show you the overall impact, below is a graph of both new + existing home sales over the past year (remember that’s all that the NAR lets FRED publish) (blue), compared with the average of new + existing home prices (red):

On a combined basis, sales are down -10% YoY, and prices are down -5.5% YoY. Once we look at the combined data, it is easy to see that even in this severely bifurcated market, sales have led prices.
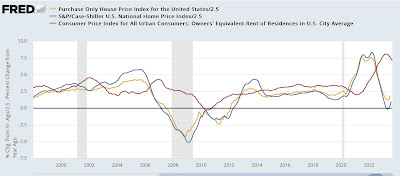
Finally, because home prices lead the CPI measure of “owner’s equivalent rent” by 12 months or more, here is an update of the YoY% changes in both the FHFA and Case Shiller Indexes vs. OER for the pat 25 years:

In the past 5 months, on a YoY basis OER has declined from 8.1% to 7.1%. If anything, I expect the decline to pick up speed from here. Because existing home prices spent so little time at the zero line before turning up again, it’s possible that OER will only decline to 2%-2.5% in the next 12 months or so. But because so many competing new house and apartment have been built, and aren’t reflecting in resales, OER could well decline lower than that on a YoY basis. We’ll see.
The bifurcation in the new vs. existing home market continues, Angry Bear, New Deal democrat
